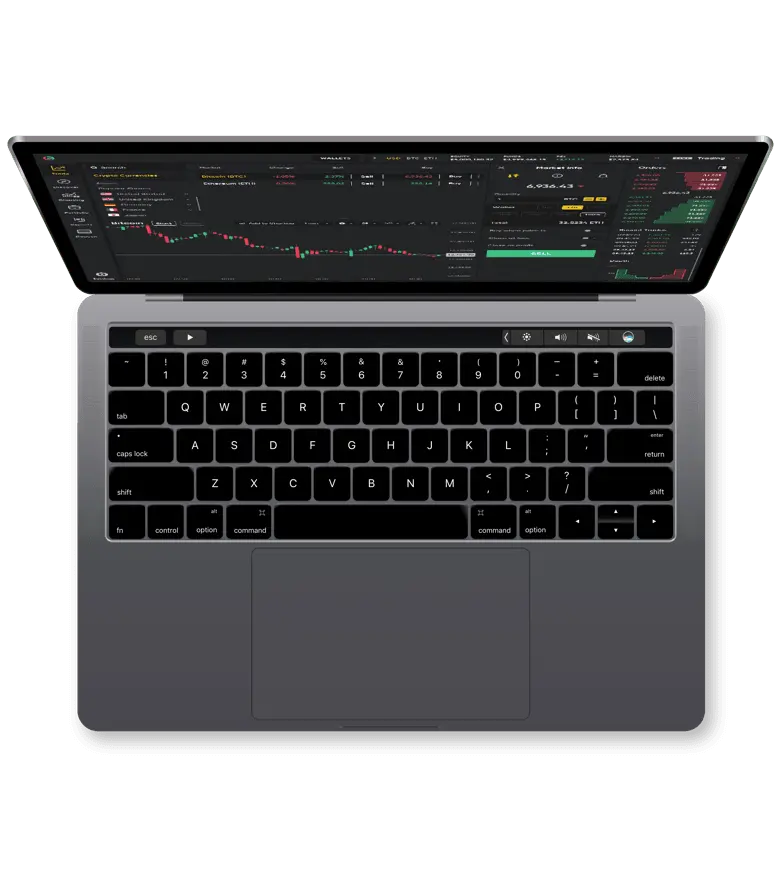
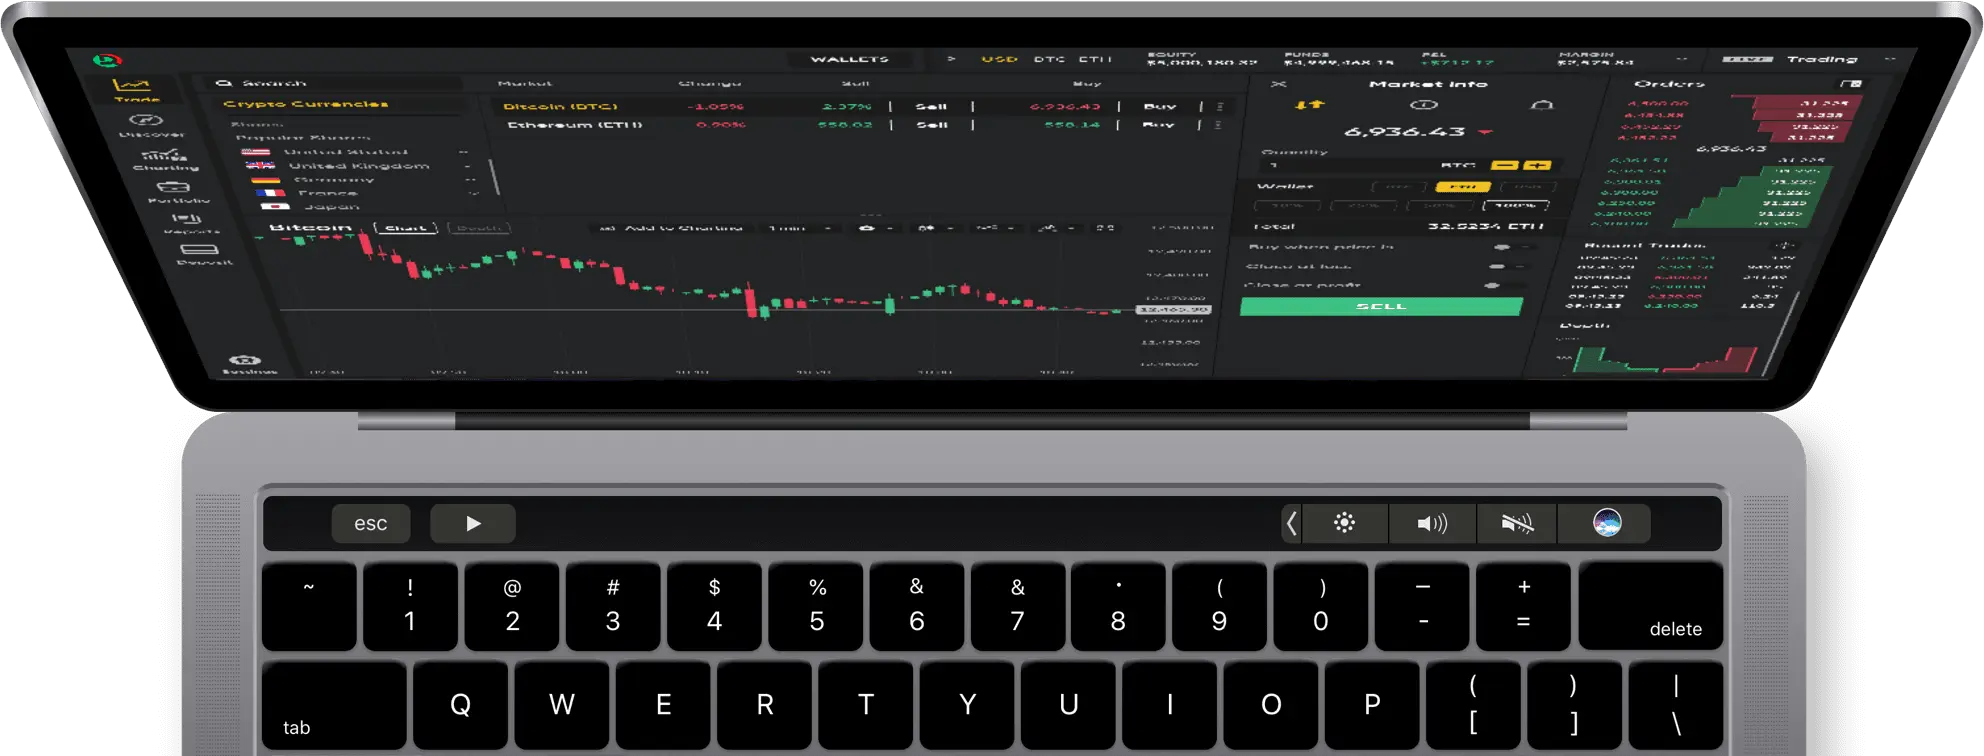
Crypto as collateral. Trade the global financial markets using Bitcoin or Ethereum.
The first in Belarus
Our advanced web platform is the first regulated tokenised assets exchange in Belarus.
Make a move on the price action of the world's biggest companies using tokenised assets.
| Icon | Name* | Sell | Buy | Chart(2d) |
|---|---|---|---|---|
|
UVXY ProShares Ultra VIX Short-Term Futures ETF |
48.49 | 48.76 | ||
|
TSLA Tesla Inc |
352.68 | 354.29 | ||
|
AMZN Amazon.com Inc |
213.82 | 214.20 | ||
|
NVDA NVIDIA Corp |
176.41 | 177.27 | ||
|
INTC Intel Corp |
50.48 | 50.85 | ||
|
RBLX Roblox Corp |
57.11 | 57.29 | ||
|
FSLY Fastly, Inc. |
31.44 | 31.62 | ||
|
NFLX Netflix Inc |
98.51 | 98.96 | ||
|
FUBO fuboTV Inc. |
12.03 | 12.12 | ||
|
SPCE Virgin Galactic Holdings Inc |
3.20 | 3.28 | ||
|
TQQQ ProShares UltraPro QQQ |
44.00 | 44.15 | ||
|
MU Micron Technology Inc |
379.81 | 382.94 | ||
|
AMD Advanced Micro Devices Inc |
219.46 | 220.50 | ||
|
SPXU ProShares UltraPro Short S&P500 |
54.61 | 54.68 | ||
|
COIN Coinbase Global Inc |
173.81 | 174.69 | ||
|
SNAP Snap Inc |
4.69 | 4.77 | ||
|
AMC AMC Entertainment Holdings Inc |
1.21 | 1.27 | ||
|
KOPN Kopin Corporation |
2.5638 | 2.5862 | ||
|
WW Weight Watchers International, Inc. |
11.85 | 12.06 | ||
|
PLUG Plug Power Inc |
2.67 | 2.72 | ||
|
META Meta Platforms Inc |
573.65 | 574.49 | ||
|
AFp Air France-Klm |
8.990 | 9.075 | ||
|
AAPL Apple Inc |
256.97 | 258.41 | ||
|
U Unity Software Inc |
21.96 | 22.28 | ||
|
OXY Occidental Petroleum Corp |
62.79 | 63.26 |
Our advanced web platform is the first regulated tokenised assets exchange in Belarus.
Crypto as collateral. Trade the global financial markets using Bitcoin or Ethereum.
Security as priority. The safety of your holdings is guaranteed in accordance with the legislation of the Republic of Belarus.
Technical indicators. Keep an eye on your positions with over 75 advanced charts, price analysis and price alerts.
Control your capital. Use stop-loss and take-profit orders to keep what you earn.
Use the world’s first regulated tokenised assets exchange to build a diverse investment portfolio with your crypto holdings. Make your deposits in Bitcoin or Ethereum to trade global financial instruments with competitive leverage and tight spreads. Dzengi.com keeps your holdings secure and accessible at a glance.