EUR/TRY
Sell48.74408
Spread0.35000
Buy49.09408

Trade Euro / Turkish Lira - EUR/TRY chart

Sell48.74408
Spread0.35000
Buy49.09408
1m
5m
15m
30m
1H
4H
1D
1W
History
The base currency token – EUR.cx. The counter currency token – TRY.cx. The EUR.cx to TRY.cx chart is the euro to the Turkish lira currency pair. It shows how much the EUR is worth when measured against the TRY. Throughout history, Turkish lira was pegged to different currencies, including the US dollar, the French franc and the British pound. During pre-crisis environment, this pair experienced high volatility that attracted many traders. Since that time, volatility reduced, because of the adoption of monetary policy, aiming to establish and maintain price stability in Eurozone.
White Paper Declaration (tokens representing currencies)
White Paper Declaration (barterable tokens representing currencies)
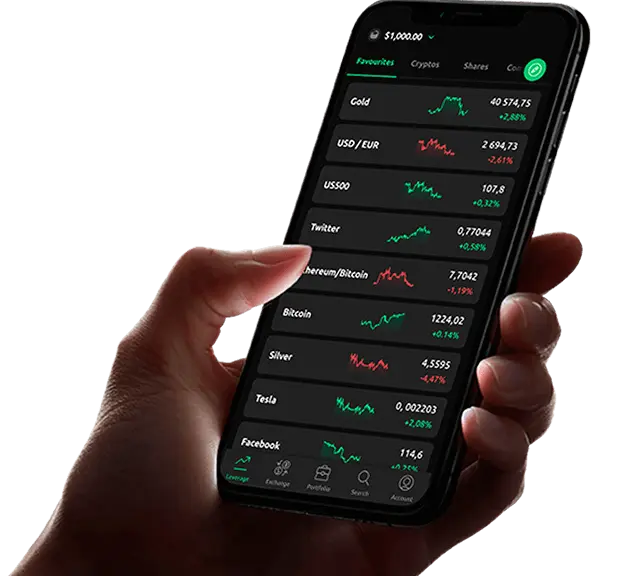
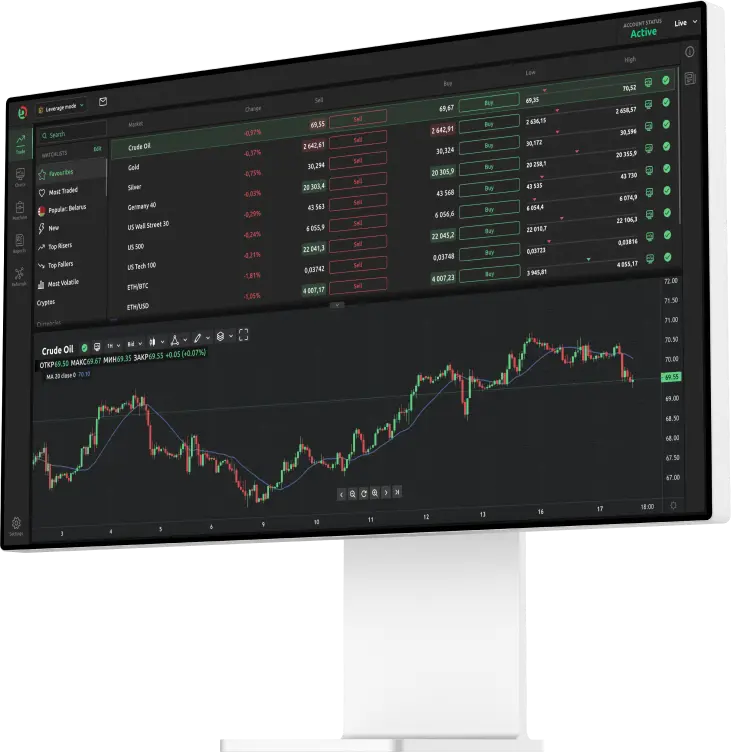
Trade the world’s top tokenised stocks, indices, commodities and currencies with the help of crypto or fiat
Articles
Bitmine buys another $49M in ETH as Tom Lee warns of strained market maker liquidity
Solana price prediction: Can SOL recover after a sharp market drop?
Pi Network claims MiCA compliance, pushes for regulated EU exchange listings
XRP price on the edge: will these catalysts spark a reversal?
1 BTC
Invest
50 BTC
Profit
Leverage:
x50

The Power Of Leverage

Trade in the big leagues with 100 Bitcoin for every 1 Bitcoin you put in

EUR/TRY price history

Date Close Change Chg% Open Min. Max.
2022-09-30 48.74408 -0.13445 -0.28 48.87853 48.72887 49.0598
2022-09-30 48.89051 0.01054 0.02 48.87997 48.74182 49.03638
2022-09-30 48.87862 -0.08577 -0.18 48.96439 48.47908 49.14566
2022-09-30 48.96394 -0.02234 -0.05 48.98628 48.82498 49.17738
2022-09-30 48.9714 -0.10300 -0.21 49.0744 48.60647 49.20023
2022-09-30 49.0741 0.08400 0.17 48.9901 48.88266 49.11658
2022-09-30 48.78723 -0.32220 -0.66 49.10943 48.5617 49.35475
2022-09-30 49.08699 0.12386 0.25 48.96313 48.90517 49.33294
2022-09-30 48.96197 0.02013 0.04 48.94184 48.51013 49.01472
2022-09-30 48.94284 0.20956 0.43 48.73328 48.43197 49.03963
2022-09-30 48.7337 0.05656 0.12 48.67714 48.67529 48.90893
2022-09-30 48.67762 -0.12957 -0.27 48.80719 48.63119 48.80719
2022-09-30 48.69936 0.03460 0.07 48.66476 48.58954 48.98705
2022-09-30 48.63357 0.26032 0.54 48.37325 48.35199 48.72341
2022-09-30 48.35151 0.09951 0.21 48.252 48.21739 48.43252
2022-09-30 48.25267 -0.12124 -0.25 48.37391 47.84085 48.55897
Go help.dzengi.com
Dzengi.com Exchange
Trade BTC & tokenized stocks