EUR/ZAR
Sell20.58142
Spread0.01611
Buy20.59753

Trade Euro / South African Rand - EUR/ZAR chart

Sell20.58142
Spread0.01611
Buy20.59753
1m
5m
15m
30m
1H
4H
1D
1W
History
The base currency token – EUR.cx. The counter currency token – ZAR.cx. The EUR.cx to ZAR.cx chart is the euro to the South African rand currency pair. It reflects how much the EUR is worth when measured against the ZAR. The Eurozone unites 19 nations and euro is used by more than 320 million Europeans. South Africa is a middle-income emerging market and the largest global producer of gold, platinum and chromium. The word “Rand” in South African rand stands for the ridge in Johannesburg with the country’s largest deposits of gold. ZAR has a relatively high interest rate, which makes it a popular trading currency.
White Paper Declaration (tokens representing currencies)
White Paper Declaration (barterable tokens representing currencies)
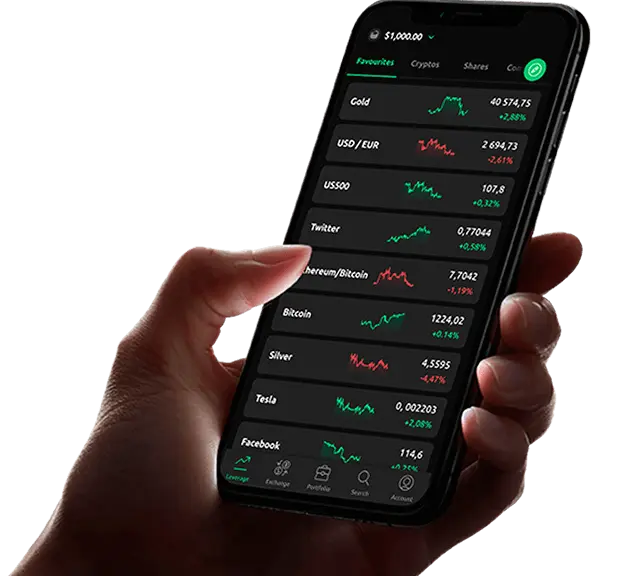
Trade the world’s top tokenised stocks, indices, commodities and currencies with the help of crypto or fiat
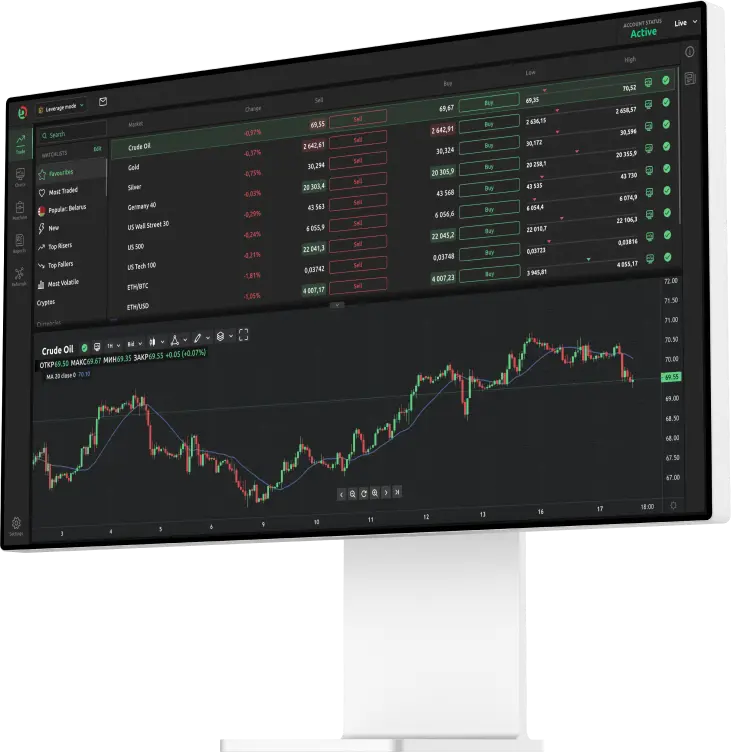
Articles
XYO layer 1 blockchain launches alongside XL1 utility token
TaskUs accused of ‘silencing’ employees investigating Coinbase data breach 
Eric Schmidt-backed Keeta plans mainnet launch with 235m wallets
Bitcoin price eye $117K breakout as sell pressure drops
1 BTC
Invest
50 BTC
Profit
Leverage:
x50

The Power Of Leverage

Trade in the big leagues with 100 Bitcoin for every 1 Bitcoin you put in

EUR/ZAR price history

Date Close Change Chg% Open Min. Max.
2022-09-30 20.56134 0.00708 0.03 20.55426 20.54164 20.57686
2022-09-30 20.55251 -0.02551 -0.12 20.57802 20.4488 20.61899
2022-09-30 20.57727 0.16045 0.79 20.41682 20.40475 20.57817
2022-09-30 20.41607 0.08228 0.40 20.33379 20.32265 20.45647
2022-09-30 20.33383 0.04251 0.21 20.29132 20.20623 20.3516
2022-09-30 20.37883 0.01900 0.09 20.35983 20.32304 20.42144
2022-09-30 20.35983 -0.09598 -0.47 20.45581 20.33531 20.51751
2022-09-30 20.45581 -0.06967 -0.34 20.52548 20.4103 20.57643
2022-09-30 20.52448 -0.03385 -0.16 20.55833 20.3623 20.58375
2022-09-30 20.55808 -0.05989 -0.29 20.61797 20.51458 20.6308
2022-09-30 20.61745 0.10267 0.50 20.51478 20.3674 20.63158
2022-09-30 20.57428 -0.11584 -0.56 20.69012 20.50278 20.70146
2022-09-30 20.69087 0.10700 0.52 20.58387 20.5731 20.74379
2022-09-30 20.58637 0.00261 0.01 20.58376 20.51327 20.63797
2022-09-30 20.58372 -0.04706 -0.23 20.63078 20.51779 20.6708
2022-09-30 20.63078 0.00425 0.02 20.62653 20.50678 20.66126
2022-09-30 20.6265 0.00586 0.03 20.62064 20.50926 20.63426
2022-09-30 20.59677 -0.04879 -0.24 20.64556 20.57477 20.74653
2022-09-30 20.64556 0.04596 0.22 20.5996 20.53232 20.6758
Go help.dzengi.com
Dzengi.com Exchange
Trade BTC & tokenized stocks