This strategy offers the chance of high profits but there could be higher costs

What is momentum trading?
Momentum trading is a strategy used by traders to define entry and exit positions based on the underlying asset-price strength.
The strategy is based on the idea that a price that is increasing will tend to move even further upward, and when the price is falling, it is likely to continue to drop.
Therefore, momentum traders try to identify securities that exhibit strong momentum and where the price is likely to continue to move in the same direction.
The price momentum can be a basis for opening positions because periods of increasing prices attract buyers who put upward pressure on the price. And when the prices fall, sellers are attracted and the pressure from the additional sellers may push the price further down.
Elements in momentum trading
Essential elements in momentum trading or factors affecting the price momentum are the volatility, volume and time frame.
The asset’s volume represents the quantity of the particular assets that have been bought and sold on the market over a specific period. An adequate level of volume would be an indication that there is enough demand and supply for that particular asset, and that traders can easily buy or sell the asset.
Volatility represents the size of the price changes for a given asset – wider price swings could mean that the potential profits to be made will be higher, but the potential losses could also be bigger. This is where momentum traders will pay special attention because they want to make profits through increased volatility – when prices increase or fall in a short period. To minimise potential losses that may arise from the higher volatility, traders can place stop-loss points.
Time frame – Despite the fact momentum-trading strategies are commonly considered short-term strategies, you can hold your position for a longer period if the momentum continues. This means longer-term traders can also use momentum trading.
Types of momentum
There are two types or methods for measuring the price momentum of an asset. They differ in terms of the bases for analysing the current price momentum and the anticipation for it in the future.
- Absolute momentum – this refers to the notion that market behaviour is reflected in the asset’s price through its relation with the price movements in the past. Put simply, the absolute momentum compares the price momentum to itself; and
- Relative momentum – a method in which the price momentum of individual assets is evaluated against the price momentum of other individual assets.
Popular momentum indicators
Traders can use a variety of technical analysis indicators to measure or estimate the market momentum. Usually, these are oscillator indicators, which can fluctuate within a bound or can be unbounded.
The main purpose of using momentum indicators in your trading strategy is to gain insight into the speed at which the price moves in the trend direction, determine entry or exit points, or identify potential trend reversals.
Momentum indicator: A leading oscillator indicator applied by traders to detect potential overbought or oversold market conditions as well as the strength behind the current trend.
Stochastic oscillator: The calculations behind the stochastic oscillator are based on the last closing price and the high–low range for the period. The indicator is shown as two lines moving within the 0 –100 range so traders can determine whether the signals show it is overbought (if the line is above 80) or oversold (if the line is below 20).
Commodity channel index (CCI): This measures the typical price (which is the average from the high, low and closing price) for a given period in relation to the moving averages and the mean deviation of the average price. As is the case with some of the other indicators, traders can identify overbought market conditions using the commodity channel index (when the CCI is above 100) or oversold market conditions (when the CCI level is below 100).
Moving average convergence divergence (MACD): A technical momentum indicator that considers two exponential moving averages (EMAs): faster EMA and slower EMA, and a signal line. The (MACD) indicator is used by traders not only to identify the price momentum, but also to detect potential trend reversals.
There are many other momentum indicators you can use to define trading strategies. Try to find the best combination of indicators to identify and validate trading signals.
Your momentum trading strategy will depend on the technical indicators, the candlestick patterns, or both. When defining strategy, look for potential buy or sell signals through the respective crossover's strategies. The aim is to try to find specific histogram formation or price-bar formation, or wait for a divergence to appear between the price movement and the indicator.
Momentum trading strategies
The momentum trading strategy can be based on pullbacks, which means you will be waiting for a temporary pullback from the primary trend to enter your position. Some traders consider the resistance and support levels when trading pullbacks as relevant because in the sense that the initial resistance levels become the new support levels and vice versa.
Another strategy that can be used is the momentum breakout strategy, which is applied for detecting entry signals.
Using this strategy, traders try to identify potential momentum breakout patterns to spot when the price will move outside the resistance or support level and the opportunity to determine the trend direction. When looking at the breakout strategy, you want to see long, bullish or bearish Doji candlesticks that move above the resistance or below the support line.
The identified candlestick is referred to as the momentum candlestick. Look at the following example:
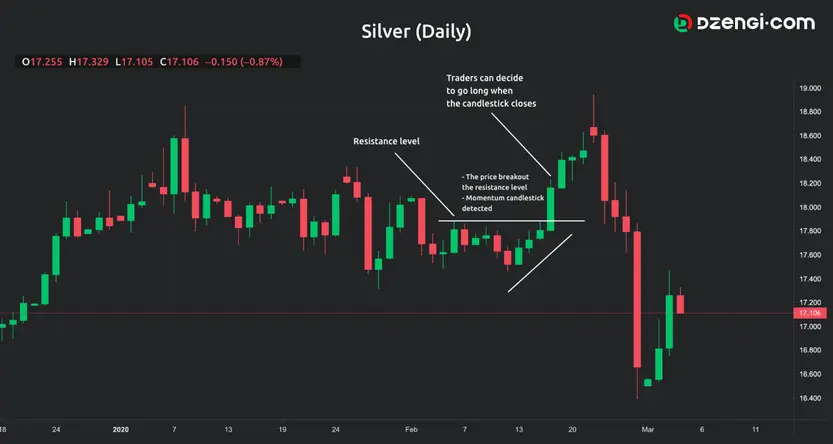
The graph above shows the potential buy signal determined through the momentum breakout strategy.
Now, look at the momentum candlestick that breaks out the resistance level. After that, the price continues its upward movement.
Traders can open a long position when the momentum candlestick closes. Of course, you can define other breakout patterns in their strategy depending on the instrument traded and the technical indicators used.
Momentum-trading candlestick strategy
Your momentum trading strategy can also include price action.
Try to identify candlestick (or bar) patterns or candlestick momentum to detect potential entry and exit positions. Consider the length of the candlestick and the opening and closing prices. There are numerous patterns that you can try to find – and you can also estimate the momentum in different ways.
One way to see whether the candlestick is losing its momentum is to examine whether the pullback is 50% of the bar range.
Traders can also determine whether the price loses momentum by looking at multiple consecutive bars. If, for example, the bars are becoming smaller but they are moving in the same direction, then it could be a sign of diminishing momentum. So, if you decide to trade based on price action, you need to understand the meaning of the different candlestick forms.
Things to consider when applying momentum trading
- Define asset-selection criteria so that you can decide which securities will be adequate for this type of trading strategy. You can specify a level of volume, the degree of volatility, etc that should be fulfilled by an asset before you consider it for trading
- Well-defined risk-management principles
- Carefully define your stop-loss strategy
- Define a risk-reward ratio and use it in your trading strategies
- Try to find a trend.
Advantages of momentum trading
- It provides an opportunity for generating high profits in a short period when traders open their position on time
- Traders benefit from market volatility because traders will execute a momentum trading strategy for assets with an adequate degree of volatility
Disadvantages of momentum trading
- There could be a higher level of costs due to the higher turnover
- Traders should ensure that they know what is happening with the price and the momentum to be able to exit the position at the right moment
FAQs
Absolute and relative momentum are used to analyse price momentum. Absolute momentum compares the price momentum to itself. Relative momentum is the comparison of prices of individual assets.
Momentum trading can generate high profits in a short period and traders can benefit from market volatility.
Stochastic oscillator, Commodity channel index and Moving average convergence divergence (MACD).