The indicator is a useful tool when you want to identify potential buy and sell points

Williams Percentage Range, Williams %R or simply %R is a technical indicator promoted by the popular chartist and trader Larry R. Williams in his book, How I Made One Million Dollars Last Year Trading Commodities. The indicator has been part of the Larry Williams trading strategy since 1973.
You can use this indicator for different markets such as stocks, forex, and cryptocurrencies. It is based on the concept that prices will close at new highs when the trend moves in an upward direction or the price closes at new lows in a period of a downward trend. Having this in mind, Williams %R calculation is performed using the high, low and closing prices of an underlying asset. The Williams percentage range formula is:
Williams %R = (Highest High – Close) / (Highest High - Lowest Low) x -100
The highest high and lowest low are the highest and lowest prices reached during the period considered. The common default setting is 14 periods (Williams used 10 days in his strategy) depending on the platform and it could be applied for periods in intraday frameworks or for days, weeks, etc.
The indicator displays the position of the last closing price in reference to the highest price during the lock back period. It is considered as an alternative to the stochastic oscillator indicator since they have multiple similarities. The difference, though, is that the stochastic provides insight into the level of the closing price in relation to the lowest price for the periods and it is plotted with two lines, unlike the %R. Also, while the Williams %R takes values from -100 to 0, the stochastic takes the values from 0 to 100, but the lines of both indicators will oscillate in the same manner.
How to read Williams %R
The Williams %R indicator is a bound oscillator type of indicator and will appear at the bottom of your chart as a line oscillating between the values of -100 to 0. There are some generally accepted rules such as:
- Indicator values lower than -80 will be an indication of oversold market conditions
- Values above -20 will point toward overbought market conditions
- Readings above -20 show that during the defined period, the assets have been trading around the top of the period's high-low range
- Values below -80 indicate that the instrument is traded at the lower side of the high-low range for the selected period
- Extreme values close to 0 or 0 display that the price is trading close to the highest or above the highest high for the period
- A value of -100 indicates that the price trades near or below the lowest low, which can be highly important for traders and their strategies
It is worth noting that when the indicator is above -20 or below -80, it doesn't necessarily mean that the price will always reverse after reaching this value. You should be aware that in a strong upward trend, Williams %R can show an overbought alert, but the price can be sustained for a prolonged time in the overbought zone.
The opposite is true in periods marked with a strong downward trend when the price can remain in the oversold area. Traders try to identify patterns and apply other technical analysis and methods to detect potential trading positions. An example of the Williams %R indicator is presented in the graph below.
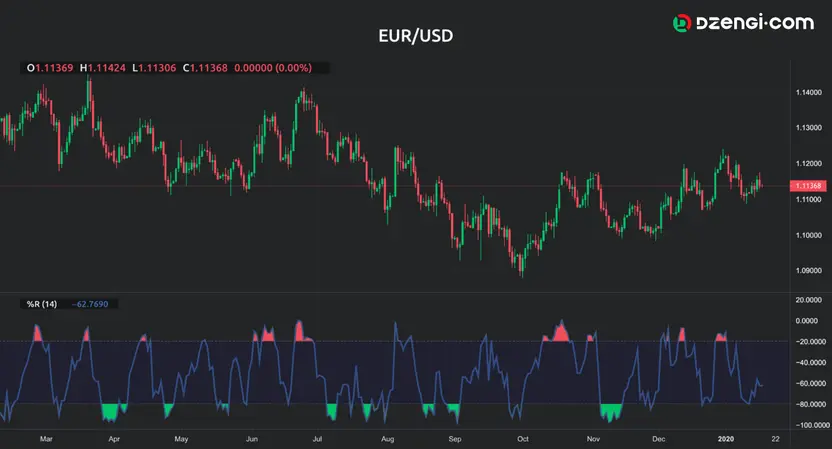
You can see the overbought and oversold alerts on EUR to USD chart. The Williams %R takes value above -20, indicating an overbought market at the points marked with red. On the other hand, an oversold market is displayed with the yellow areas when the Williams %R reads values below -80.
How to use Williams %R indicator
You can also use Williams %R to identify potential signals for going long or short, looking for alerts when the %R value crosses the -50 centreline or attempting to identify divergences.
- Generally speaking, traders can enter a long trading position when the %R line crosses below the -80 value and moves into the oversold zone
- A short position signal appears when the Williams %R line crosses above the -20 value and moves in the overbought area
According to Williams, you should buy the asset when the indicator reading is below -90 during a strong upward trend, while sell position is opened when the reading is from -10 to 0 during a downward trend. Let's look at the following graph.
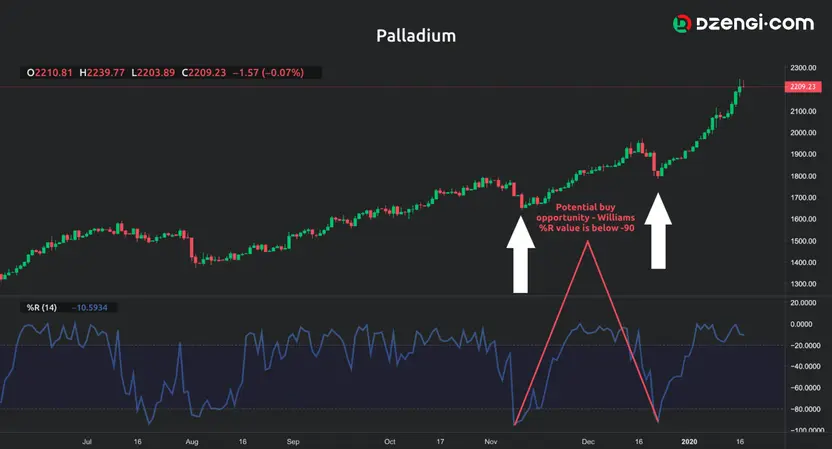
You can see that the Palladium displays an upward trend on the daily time frame. The points where the Williams %R readings are below 90, the red lines, signal potential buy positions. After %R exhibits extreme value, the price starts to move upward, the white arrows, and the trend continues.
Traders can also define their Williams R trading strategy by looking at the -50 value when they look for the point where the %R line crosses this mark. Crossing the -50 value may display changes in the momentum and traders can enter positions following the directional movement of the cross.
- If the Williams %R line crosses above -50 it is signalling potential bullish movement
- When the line moves below the -50 it alerts for possible bearish movement
You may open your trading positions in the direction of the cross. For instance, when the line crosses below the centreline after reaching the overbought level, it signals an opportunity for a sell position to be opened.
You can be on a lookout for momentum reversal alerts when the %R goes back to the oversold or overbought zone multiple times, but it didn't manage to go back to the extreme area. When traders identify such a setting on the chart, it can be an alert that the momentum may be losing strength and a reversal in price movement may be expected.
Divergence Williams %R trading is a strategy when you look for the periods when the price and the indicator move in opposite directions. Through the divergence alerts, you can identify potential trend reversals or trend continuation.
- The bullish divergence appears when the price reaches a new low while Williams %R indicator has a higher low
- The bearish divergence occurs when the price has a higher high and the indicator has a lower high
There is a difference in opinions regarding the applicability of Williams %R during trending market conditions or range-bound market. Some traders believe that Williams %R is better used during ranging markets as opposed to trending markets conditions because in periods of a strong trend, it can provide misleading overbought or oversold signals. On the other hand, traders use this indicator during a trending market because they can identify trending momentum.
Advantages of Williams %R trading indicator
- Applicable for different time frames
- Can be used to measure trend strength
- Can be used during trending as well as sideways moving markets
- It can identify a potential reversal before the reversal takes place
Limitations of Williams %R trading indicator
- Overbought and oversold signals are not reliable because the trend may not reverse after the %R reaches the overbought and oversold areas
- Based on the overbought/oversold alerts, traders can close their positions before the market and lose their strength and lose potential profits