The Fibonacci retracement can indicate potential reversals in price movements

The Fibonacci retracement indicator is based on so-called retracements, which are periods in which the price moves against the trend, after which it moves back in the trend direction. These movements last for short periods. The Fibonacci retracement indicator uses numbers pointed out by Leonardo Pisano (known as “Fibonacci”), a mathematician from the 13th century.
The Fibonacci retracement shows percentage retracements in accordance to the Fibonacci sequence numbers. In the Fibonacci sequence, each number of the sequence is the sum of the previous two – 0,1,1, 2, 3, 5, 8, 13, 21, 34, 55, 89, 144, and so on. The sequence continues to infinity.
How to plot it on your chart
On your chart, you will see the indicator as different lines for different levels. The set-up of this indicator is a straightforward process since it is a built-in tool in most trading platforms. When plotting it, you should draw a line from the lowest price to the highest price (or vice versa, if it is a downward trend) and the levels will be placed automatically.
Before plotting the Fibonacci lines on your chart, set a trend line connecting two extreme price points, such as the lowest and the highest prices for the period. Afterward, each Fibonacci level is presented as a horizontal line, which intersects with the trend line.
The Fibonacci levels for each line are expressed as a percentage for the retracement and they are: 0.0, 23.6, 38.2, 50, 61.8, and 100% (other levels may also be used). The ratio of 61.8% is considered the golden ratio and it is the value obtained when you divide one Fibonacci number by the next Fibonacci number (for example, 89/144 = 0.6180).
The 38.2 level represents the number obtained when you divide one Fibonacci number by the number two ahead of it in the sequence – for instance, 34/89 = 0.382. Other Fibonacci retracement levels are calculated based on ratios or rules that follow the Fibonacci sequence.
An exception to this rule is the 50% level, which is not based on the sequence. Instead, the level comes from the Dow Theory (written by Charles H Dow, an American journalist and co-founder of Dow Jones & Company), according to which the averages commonly retrace halfway from their prior move.
The aim of using these levels is to examine how much the price has retracted or corrected compared to the previous movement. You will use the Fibonacci retracement lines to identify potential points at which prices will bounce back and reverse towards the previous movement.
You can set up your Fibonacci retracement indicator on a chart for different assets and financial instruments and for different time frames. It should be noted, though, that longer time frames can provide a better overview of the price movement toward retracement levels compared to short time frames.
Understanding Fibonacci levels depth
You can plot different Fibonacci levels on your asset chart. Since the levels represent the size of the retracement from the prior movement, there is a difference from one level to another in terms of their depth. The 23.6% retracement level can be considered as being shallow. The 38.2% to 50%level has a moderate depth, while the 61.8% (or ‘golden’) retracement level has higher depth.
Fibonacci retracement trading strategy
The indicator is used by traders as part of a trading strategy because it can help predict potential entry and exit points and whether you should go long in the market, or should sell – or short sell, for that matter. As a trader, you can expect that prices will probably reverse toward the trend direction once they reach certain Fibonacci retracement levels.
Fibonacci trading is recommended in a trending market. Hence, you should primarily try to identify a strong market trend, or be on a lookout for an asset in a strong trend. In periods of trending market conditions, prices exhibit a certain level of a pullback before they reverse. You can set up the Fibonacci indicator levels to determine signals for a potential reversal and open a position in the same direction as the primary trend.
Executing trades using a Fibonacci trading strategy would mean you look for entry points at the retracement and wait for the price to move back in the direction of the initial trend. Fibonacci retracement can also be used to identify signals for a potential reversal in prices.
Fibonacci support and resistance levels
Fibonacci support and resistance levels are the levels at which you can expect a reversal, and the levels can signal entry points.
When using the levels as a support or resistance, the idea is that you will take long positions when retracements reach a Fibonacci support level during an upward moving trend. You may want to wait and see whether the price will stand around the level and buy when the price starts moving upwards. On the other hand, you will adopt a sell position when the price reaches the Fibonacci resistance levels in a downward trend.
When using a technical analysis tool, it is expected that prices are prone to repeat their past behaviour and their retracements to a certain level can indicate a potential reversal. Consequently, you should search for Fibonacci patterns in terms of their levels when defining your trading strategy
Fibonacci trading can be a profitable way of entering and exiting trading positions, but you should be aware that not all retracements will reverse toward the initial trend. This means you cannot simply assume a profitable signal every time a price reaches a certain level.
The Fibonacci retracement indicator can provide the best results when it is part of a trading strategy composed of multiple indicators. Use the Fibonacci retracement together with other tools and indicators such as candlestick patterns, oscillators, moving averages, relative strength index (RSI) or price action levels.
Fibonacci retracement example
In the example below you can see how to place Fibonacci retracement lines on your chart, and how to use the lines marking the Fibonacci levels to identify retracement and potential entry points.
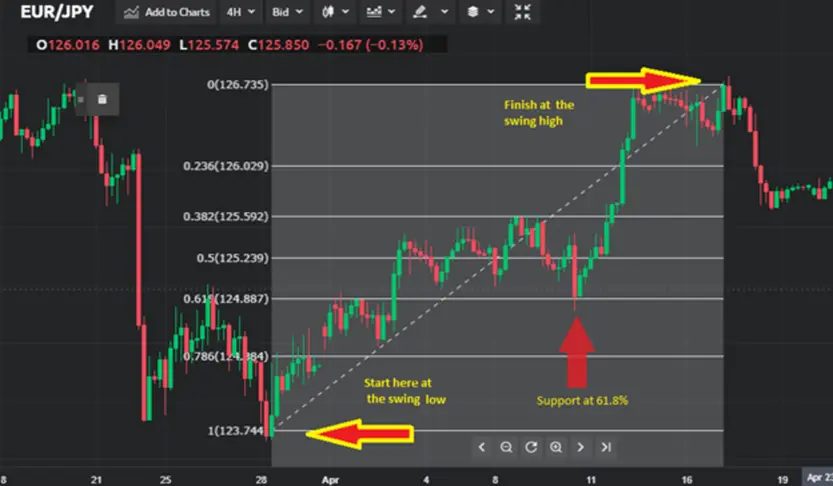
Remember that when you plot the Fibonacci retracement in an upward trend, you will drag the line from the lowest price point toward the highest price. On the graph above, you should start from the swing low and end the line at the upper part of the graph where the swing high is found. After plotting the line, you can see that the price retracts at some Fibonacci levels (the horizontal lines), which serve as support, and then reverses in the same direction as the trend.
Here is another example, where the retracement is still at the 61.8% level and at the 50% level.
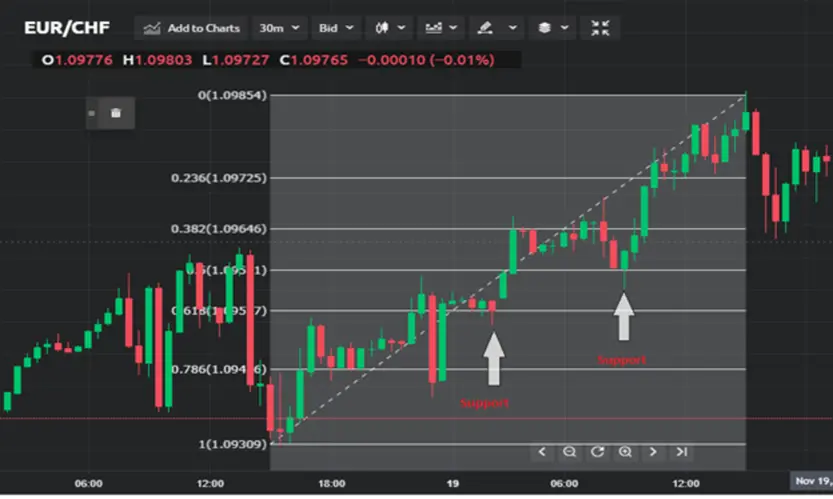
After the price retracts down to the Fibonacci level, it reverses and moves back again and continues in the trend direction. As you can see from the two examples, there could be differences in the retracement level for different types of assets.
Therefore, when you use the indicator, you will be on a quest to look for a Fibonacci pattern in the price reversals and identify potential retracements based on the plotted levels.
Advantages of the Fibonacci retracement indicator
- It’s a simple trading tool when it comes to setting it up on your chart
- The levels are static (compared to the moving average indicator, for example), so traders will wait for the price to reach the predefined levels and act accordingly
- It’s applicable to most assets
- You can confirm market movement by identifying the Fibonacci retracement support and resistance levels
- It offers the possibility for the anticipation of a buy or sell points.
Disadvantages of the Fibonacci retracement indicator
- Fibonacci levels are subjective
- Although it is simple to use from a technical point of view, it may require a certain level of knowledge when you need to distinguish between a temporary retracement and an extended reversal
- Fibonacci retracement is used by many traders, thus, it can be thought of as a self-fulfilling prophecy. Many traders may take action around the same price levels, pressuring the price movement in the same direction.