Moving average is a handy tool that helps to quickly determine overall long-term trends

Moving average (MA) is a commonly used technical analysis indicator. It eliminates the effects of short-term price changes, smooths out the price history accordingly and provides an overview of the average price for a specific period in the form of a single line.
You can use the moving average to recognise and determine potential trend directions or periods of flat market when the prices don't fluctuate. Moreover, you can determine the support and resistance levels and define your entry or exit strategy as a complement with other indicators. Although you can find different types of moving averages indicators, the two widely used are simple moving average and exponential moving average.
From a technical point of view, setting the moving average is rather straightforward, because all you have to do is to select the desired type of moving average and define the time-frame. Based on the number of days represented by the MA, it can be used for identifying short-term, medium-term and long-term trading signals.
Choosing a time-frame
Traders usually use the following time-frames:
- Five days, 10 days, and 20 days when determining short-term trends
- 30 days or 50 days MA up to a 100-day time-frame, for a mid-term trend direction
- 200 days, 250 days, in general, time-frames above 100 days if you want to see the long-term trend direction. The 200 and 250 days time-frames are sometimes referred to as the “bull-bear line” and traders use them to determine whether there will be a bullish movement or bearish movement
As you can see, it is a customisable indicator and you have the opportunity to modify its timeframes in accordance with your strategy and trading needs.
Why is the moving average method used?
The moving average is a handy instrument because you can use it as a standalone indicator or combine it with other indicators. Also, you can plot together multiple moving averages with different timeframes in order to detect and confirm the trend movement. Some traders set up to three moving average indicators with short, medium and long-term time-frames when analysing the trend. It’s worth mentioning that aside from the daily time-frame, moving average also can be defined with an hourly time-frame.
The “right” set up of a moving average indicator depends solely on your preferences as a trader as well as your trading strategies. There is no “correct” set up of this indicator even though there are some generally accepted time-frames. When defining the moving average parameters, traders also use the Fibonacci sequence numbers for the time-frames.
Moving average signals
Moving average indicators can help you identify different types of signals.
Trend
The most common signal is the trend. An increasing MA will point towards an overall price increase, while a decreasing MA will recognise a decrease in the overall price level. When you want to identify a long-term trend, apply a longer time-frame such as 200 days. If an increase in the moving average is evident, then you have successfully determined an upward trend.
Crossover
You can also use two moving averages to identify crossover trading opportunities. Traders do this by combining short-term MA with a medium-term or long-term moving average. Setting up two moving average indicators, short-term and long-term moving average can be referred to as price crossovers. The general rules for crossover signals are:
- When you see that the short-term moving average crosses over the long-term moving average then it means a bullish signal (bullish crossover) also named a “golden cross”
- If the short-term moving average crosses below the long-term moving average, then it gives a bearish signal or dead cross
Let’s look at the graph below where the 20-day moving average and 50-day moving average are plotted
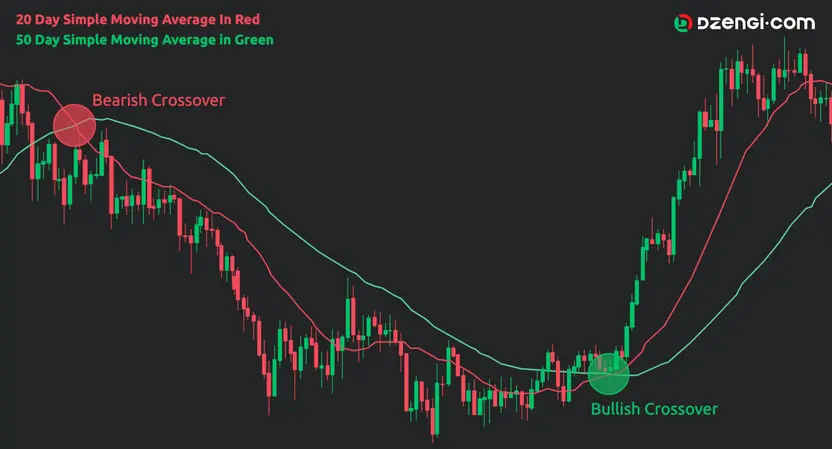
At the upper left side of the graph, the 20-day moving average line crosses below the 50-day line in a downward direction. The point is signalling a bearish movement. On the other hand, a gold cross is identified on the graph on the right side when the shorter time-frame moving average crosses over the 50-day moving average, signalling a bullish movement.
The downside is that when a stable long-term trend is not identified, the crossover signals may be inadequate because of lagging in the moving averages. Be aware that in a volatile market, you can be exposed to a whipsaw (sudden reverse movements in prices) when using the crossover signals. This is especially important for short term traders as they are more exposed to volatility compared to long-term traders.
Support and resistance
You can also use the moving average line to detect potential dynamic support and resistance levels of an asset price by looking to identify a spot where the current price meets or touches with the line. When it comes to using the moving average to identify support and resistance levels, traders read the signals as follows:
- If the price intersects the moving average line from above, then the indicator signals potential support levels indicating that the price will bounce and move upward. Consequently, a bullish moving average acts as support
- When the price touches the moving average line from below, a resistance level is determined, which means that the price will move downward. Accordingly, the bearish moving average serves as resistance
The graph below identifies the support and resistance levels using a moving average indicator.
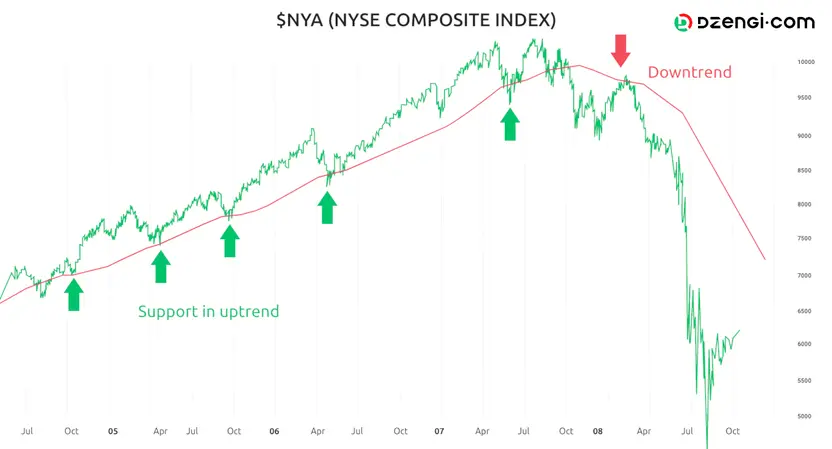
It is evident that during an upward trend, the moving average serves as a price support level, and each time the price touches the line from above, it indicates an upward price movement (points shown with green arrows). On the right side, a resistance level is identified using the moving average line (the red arrow). When the price touches the line from below it signals a downward price movement.
The pros and cons of the moving average
Benefits of using the moving average indicator in your trading strategies are:
- Simple and easy to use technical analysis indicator
- A handy indicator to swiftly determine the overall long-term trend
- It can be a powerful tool when combined with other indicators
Although MA can be used alone, it would be wiser if you combine it with other indicators because of its drawbacks
- It is based on price movements in the past and as such, it doesn't account for information which can change the future performance of an asset
- The moving average indicator may lag in a period of swift changes in prices, which can appear at reversals
- Although there are commonly used time-frames, a single moving average set-up doesn't apply across different assets. Hence, you need to identify the best set-up for different assets if you trade multiple assets. You might need different set-ups because not all assets behave and react in the same way to changing market conditions, and there are also differences in volatility
How to use moving average indicators
When you use different indicators while creating your trading strategy, you should make sure that the indicators capture multiple areas such as the trend, momentum, volatility, etc. Accordingly, the moving average as a trend indicator can be combined with indicators that identify signals through the momentum or the volatility of a price.
Momentum indicators, such as the moving average convergence divergence (MACD), are other types of indicators that are combined with the moving average signalling anticipation of changes in price direction. Also, using an oscillator indicator, such as the stochastic indicator, in combination with a moving average can help you detect potential pullbacks. Complementing the moving average with volatility indicators, such as the Bollinger bands indicator, can be useful when trading with a crossover strategy because the bands define a trading range of the price action. Moreover, a combination can be made using the moving average and the average true range indicator, along with other indicators when a trader tries to determine a potential entry point.