Learn how to detect overbought or oversold markets

What is the Commodity Channel Index?
Technical analyst Donald Lambert developed the Commodity Channel Index (CCI) in 1980, as a means of considering the current mean price in relation to the average mean price over a specific period.
The CCI is a way for traders to measure and identify potential overbought and oversold levels for a given market. CCI is also used by traders to evaluate the strength and direction of a trend, and to identify potential buy or sell opportunities. Lambert devised the indicator with the commodities market in mind, but despite its name, it is also applicable to other assets.
CCI values will be high when prices are way above the average level; this is a signal for strength. On the other hand, CCI will be low when prices are far below the average level, which indicates weakness. So let’s take a look at the Commodity Channel Index formula.
The CCI calculation takes into account a couple of elements and, for a 20-period CCI, it is performed as follows:
Typical price (TP) = (high + low + close) / 3
CCI = (Typical Price - 20 Period Simple Moving Average, or SMA, of TP) / (0.015 x Mean Deviation)
The value of 0.015 represents a constant which is defined by the creator of the indicator. The inclusion of this constant means that the majority (around 70% to 80%) of the CCI values will be between the 100 and -100 range.
The mean deviation can be calculated by subtracting the 20-period SMA of the typical price from the typical price and afterwards using the absolute values for the obtained results. Finally, you should add the absolute values and divide the result with the number of periods (20) to get the mean deviation.
How to read the Commodity Channel Index
When plotting the Commodity Channel Index indicator, you can find it in the price chart below as a line oscillating within the box. It should be noted that the indicator is an unbounded oscillator. However, the range from 100 to –100 is given by default, while some trading platforms have the option for the trader to change the range.
The default set-up for the CCI is 20 periods, but you can modify the number of periods depending on your preference. Keep in mind that a shorter-period CCI will be more volatile, and a higher portion will be above or below the 100 and -100 values. Of course, a longer period CCI will mean that a smaller percentage will be outside the 100 to -100 range.
Traders read CCI values above 100 as the possibility that an uptrend will emerge, while a reading below -100 can be an alert for the beginning of a downtrend. The following graph displays the way the CCI will look on a chart.
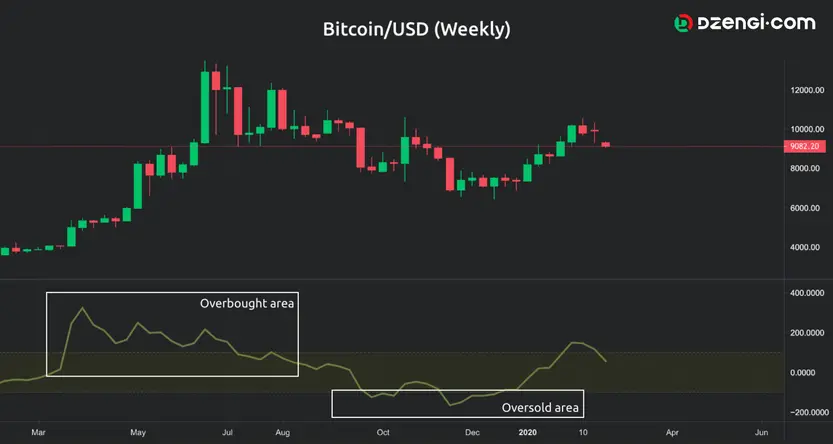
The CCI is a line oscillating between positive and negative values and because of the constant included in it the calculations, CCI will mostly move between the 100 to -100 interval. Accordingly, traders consider values above 100 to be in the overbought area, while values below -100 are read as oversold alerts.
How to use the CCI indicator
How do you use the Commodity Channel Index? Traders can use the basic Commodity Channel Index strategy to identify trading opportunities based on overbought or oversold levels during a range-bound market.
The idea behind the CCI strategy is that during overbought market conditions, the expectations are that prices will start decreasing and when the market is in an oversold state, a price increase is anticipated. Hence, traders can take a short position or long position when the CCI moves above 100 or below -100, or they could enter an opposite position from the trend direction during CCI extremes such as +200 or more.
Of course, the overbought and oversold values and interpretation are subjective, and are different for different types of instruments. However, traders use the buy and sell signals generated through the oversold and overbought alerts.
Detecting either market condition does not mean that there will be price reversal and that you should immediately open the associated position. The reason is that in times of strong trends, overbought or oversold conditions can persist for an undefined amount of time, such as days or weeks. Look at the graph below, representing the daily price movement for NZD/USD.
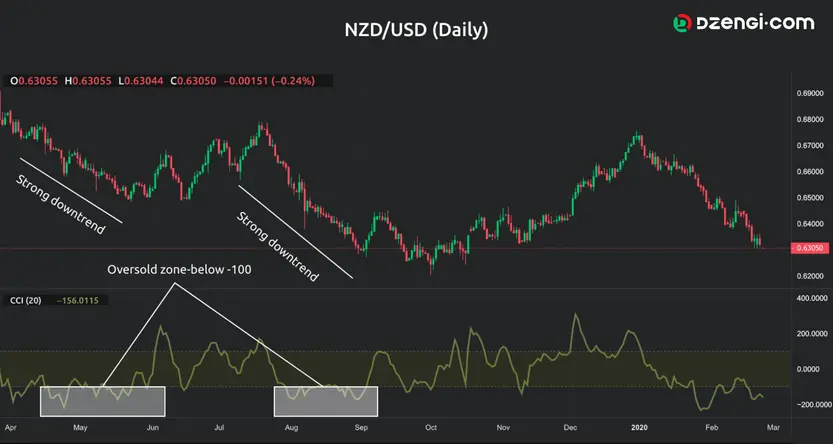
You can see that, in the red areas, the CCI values are below -100, indicating an oversold market condition, which should mean the trend will reverse – but the price continued its fall. Eventually, the trend does reverse and starts moving upwards. But trading based on the CCI oversold signals could have been misleading because of the “whipsaw” occurrence.
To filter out false signals, some traders are looking for potential bullish and bearish divergences between the price action and the CCI movement. Traders may set up a CCI trading strategy using divergence signals, because they point towards potential trend reversal as the momentum is not in line with the price movement. Hence, bullish divergence is evident when the price makes a lower low while CCI forms a higher low. A bearish divergence is formed when the price makes a higher high, but the CCI makes a lower high.
A word of caution here. Traders should confirm their signals using other indicators, especially when the price moves in a strong trend, because the signals can also be misleading.
Do not forget that the CCI can be a practical indicator which can provide valid trading signals as long as it is used correctly. Therefore, you should adapt the CCI setting, such as the number of periods and the trading strategy, to eliminate potential losses which may arise from false signals.
Advantages of the Commodity Channel Index
- CCI can provide an insight into the price momentum;
- Can come in handy to confirm the formation of a new trend or trend reversals;
- It provides traders with potential buy and sell signals.
Weaknesses of the Commodity Channel Index
- Because it is an unbound oscillator indicator, the overbought and oversold levels are subjective;
- Traders should not enter positions based on signals solely provided by the CCI, which means that you should not rely solely on CCI;
- Since it measures the price relative to the average mean price, it cannot account for relevant news which could affect the price;
- It is difficult to estimate the stop-loss points using the CCI indicator.
The CCI is a way for traders to measure and identify potential overbought and oversold levels for a given market.
Technical analyst Donald Lambert developed the CCI in 1980.
Nothing is. The CCI can be a practical indicator which can provide valid trading signals, as long as it is used correctly. Adapt the CCI setting, such as the number of periods and the trading strategy, to eliminate potential losses, which may arise from false signals.