Learn how to use the stochastic oscillator indicator to find potential entry and exit points

What is the stochastic oscillator indicator?
The stochastic oscillator is a price momentum indicator that was introduced in the late 1950s by the technical analyst George Lane as a tool to anticipate the performance of an asset. It is based on the analysis of the speed of price changes or the momentum of price because the assumption is that momentum changes precede price changes. The stochastic oscillator represents a leading indicator because of its ability to predict trend reversal signals. It can take values from 0 to 100 and it oscillates within the given range.
The stochastic oscillator calculation takes into account the last closing price and the high-low range for a predefined period. The stochastic oscillator is centered around the assumption that during upward trends, closing prices will move towards the higher end of the price range. Consequently, during a downward trend, prices tend to close at the lower end of the range. Based on the closing price and the period price range, the stochastic oscillator formula is as follows:
%K = (Current Closing price - Lowest Low)/(Highest High - Lowest Low) * 100
%D = The 3-Period Simple Moving Average (SMA) of %K
Plotting the stochastic oscillator on your chart, you will notice that it is a box placed at the bottom of the chart. The indicator consists of two horizontal lines and two lines oscillating in between the indicators’ range of 0 to 100. The oscillating line is labelled %K while the moving average (of %K) line is labelled %D.
Aside from the horizontal lines, the stochastic indicator consists of four parameters:
- %K Periods: Representing the number of periods included in the calculation of %K, where commonly used periods (can be hours, days, etc.) are 5 and 14 periods. Check the automatic setting for periods when setting up the indicator. You should try to discover the optimal period length for the assets you want to trade;
- %K Slowing Periods: Determines the smoothing process of %K and a value of 1 refers to a fast stochastic oscillator while the value of 3 denotes a slow stochastic oscillator;
- %D Periods: Denotes the number of periods used for calculation of the moving average for %K;
- %D Method: Represents the method used to calculate the %D.
When talking about this indicator, you can run into the terms slow and fast stochastic indicator. The initial calculation of the stochastic oscillator has been perceived as highly sensitive for certain types of assets. Accordingly, a three-day moving average was added as a way to slow down the degree of responsiveness of the stochastic. During your stochastic indicator settings on your platform, you can change between the slow and the fast indicator by adding the respective value in the “slowing” box (1 for fast and 3 for slow stochastic).
How to trade with the stochastic oscillator
As a momentum indicator, it is widely accepted by traders because of the possibility to anticipate potential trend reversals. The stochastic oscillator can be used to:
- Determine overbought or oversold signals;
- Identify a crossover between the two lines of the oscillator;
- Determine the trend direction;
- Identify divergence signals.
The stochastic oscillator, as a trading tool, has a broad application in terms of markets and assets as well as types of trading strategies. You can use it when analysing different types of assets, such as stocks, currency pairs, commodities and so on. Also, you can learn how to use the stochastic oscillator in your day trading strategies, scalping, swing trading, as well as with other strategies. Accordingly, you can define the stochastic oscillator strategy in which you supplement the stochastic oscillator and confirm its signals with other technical analysis indicators.
The indicator can be combined with other indicators such as the moving average convergence divergence (MACD), moving averages and relative strength index (RSI).
Based on the intended usage, you can read the indicator to determine overbought/sold signals and identify potential buy and sell signals with crossovers and/or divergence. Additionally, you can use this oscillator indicator to anticipate the future trend direction.
- Overbought and oversold alerts
Overbought and oversold signals are noticed when the indicator takes values above 80 or below 20, which serve as a threshold. When the indicator value falls below 20, then an oversold alert appears while a value above 80 indicates an overbought signal. Accordingly, you should buy when the oscillator decreases below the 20-line and starts moving back again, and you should be selling if the indicator moves above the 80-line and then starts falling down. It is worth mentioning that the signals are most accurate in range-bound market conditions.
- %K and %D line crossover signals (stochastic crossover)
In order to identify a buy signal, you should look for points where the %K line crosses above the %D line. Alternatively, the sell signal arises when the %K line crosses below the %D line.
- Looking for stochastic divergence
You can spot a divergence when the price doesn’t move in the same direction as the stochastic oscillator lines. Namely, when the price has higher highs while the oscillator has lower highs, it signals potential bearish divergence. On the other hand, if the price has lower lows and the stochastic oscillator has higher lows, then it is an indication of bullish divergence.
You should remember that the correct reading of the oscillator and most of the indicators in general means that you have primarily identified the overall current market conditions. Consequently, the signals can be different during trending market conditions and when there is a range-bound market.
Reading charts with the stochastic oscillator indicator
Let’s look at some examples for reading the stochastic oscillator indicator alerts. The following graph shows you how overbought or oversold alerts will look using the indicator.
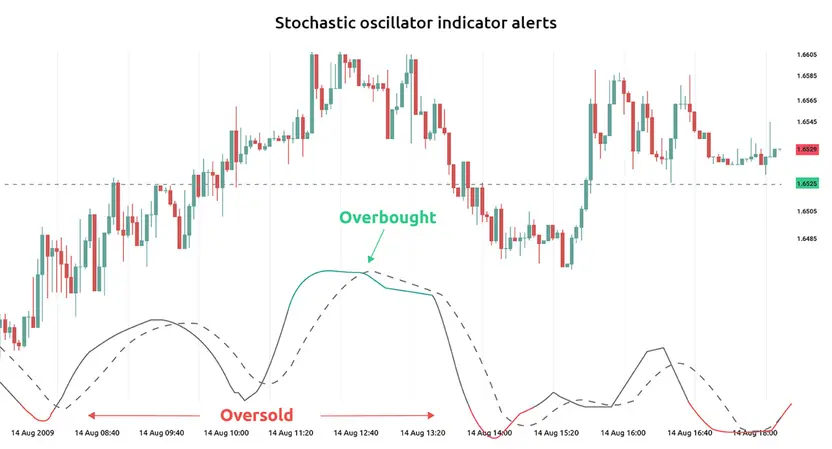
You can see the horizontal lines with respective values of 20 and 80. When the stochastic oscillator falls below the 20-line, a buying opportunity is identified. Contrary to that, you can see an area in which it is above the 80-line, indicating an overbought condition. Therefore, the indicator points toward a sell alert.
The next graph provides an example of signals determined with stochastic oscillator crossovers.
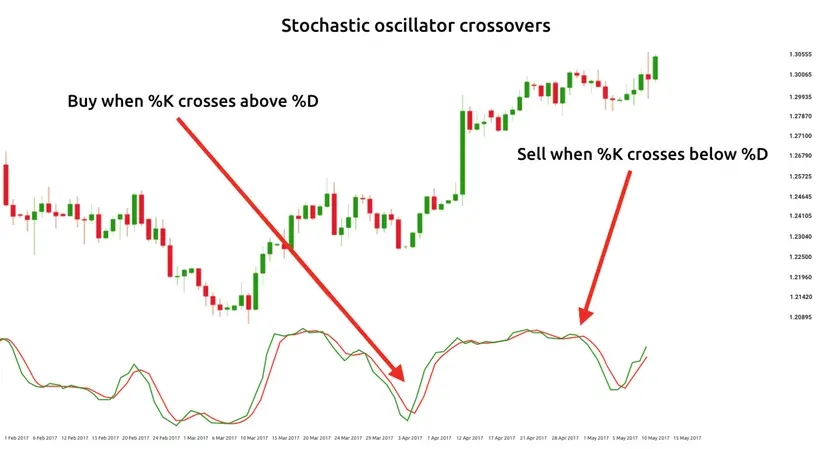
The stochastic oscillator indicator is represented with two lines, the green line %K and the red line %D. You aim to identify potential stochastic oscillator trading alerts for buy or sell action through crossovers. The first situation when a buy signal appears is when the %K line crosses above the %D line (green over the red line). A sell alert is evident in the right half of the graph when the %K line crosses below the %D line.
The last graph serves as an example for you to see how a divergence can be spotted using the indicator.
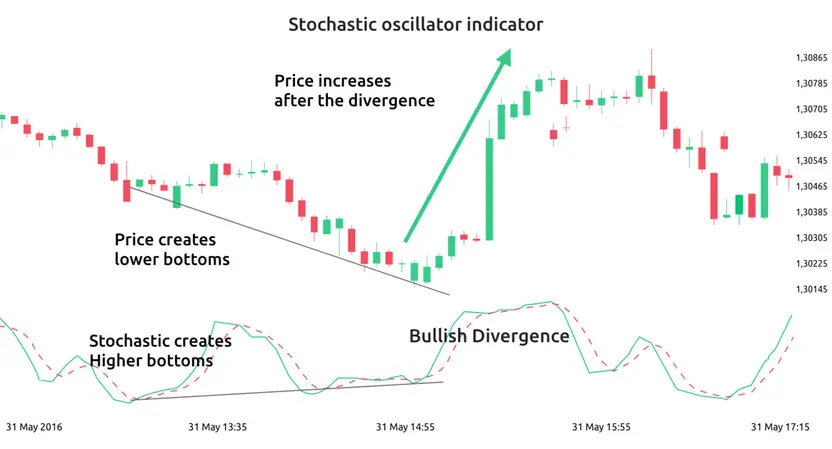
Based on the stochastic oscillator, a bullish divergence is identified on the graph. You can see that the price and the stochastic oscillator move in different directions. Moreover, the price shows lower lows while the oscillator has a higher low. The bullish divergence is an indicator of anticipation for upward movement; hence, a trader could execute a buy transaction.
FAQs
Technical analyst George C. Lane devised the price momentum indicator in the late 1950s.
The trading tool has broad applications. You can use it when analysing different types of assets, such as stocks, currency pairs, commodities and so on. Also, you can use this indicator in your day trading strategies, scalping, swing trading, as well as with other strategies.
Overbought and oversold signals are noticed when the indicator takes values above 80 or below 20, which serve as a threshold. When the indicator value falls below 20, then an oversold alert appears while a value above 80 indicates an overbought signal.