This simple technical indicator helps determine buy and sell signals or price reversals

The parabolic SAR, or parabolic stop and reverse, is one of the simplest technical indicators used by traders. It was developed in 1978 by the well-known technical analyst and trader J Wells Wilder, who is also the creator of other technical indicators that were introduced in his book, New Concepts in Technical Trading Systems. He named the trading system based on the indicator of the parabolic time/price system.
The parabolic SAR is a trend-following indicator and it is applicable when you want to confirm trend direction or identify the end of a trend. The indicator can be a useful tool to determine potential support and resistance levels and provide information for potential stop and loss signals. You can use the indicator to detect possible exit (stop) points, but traders also use it as part of their strategy to anticipate potential entry points.
How to use the parabolic SAR indicator
Unlike some other indicators, which are shown as a separate box on your asset’s chart, parabolic SAR comes in the form of dots (or pluses depending on the trading platform) plotted directly on the chart, above or below the price bars.
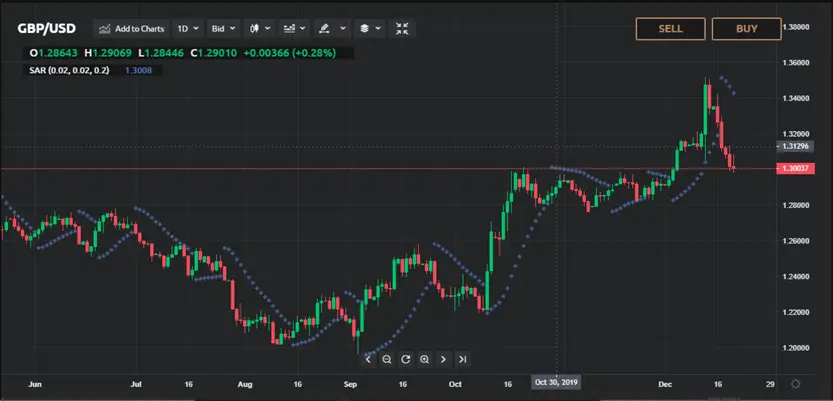
Here is an example of how the parabolic SAR trading indicator would look on your chart. On the GBP/USD graph below, you can see that the parabolic SAR indicator appears as blue pluses above and below the price charts (the colour can be different depending on the platform). The SAR points are grouped in the form of a parabola moving upward or downward as well as above or below the price.
The indicator is easy to read and use because all you need to do is to look at the position of the dots relative to the price. Dots below the price bar mean an upward trend, while dots above the price bar indicate that the trend is moving down.
You can also look at the movement of the parabolic SAR values. In an attempt to avoid false signals, traders may try to find patterns in the number of parabolic SAR dots, which are evident before a trend reversal.
Since the indicator is based on the notion that prices will increase or decrease, it is best used during trending market conditions. It is recommended that you don’t enter or exit a position based on the parabolic SAR indicator with sideways moving prices (a ranging market). That’s because the indicator’s signals may be inadequate during a weak trend.
Parabolic SAR calculation
When you calculate the parabolic SAR, values from the previous period should be considered, so it can be a bit tricky. The calculation can differ depending on the direction of the parabolic SAR (increasing or decreasing). But don’t worry, because nowadays, the calculations are done by computers. It is based on three components – the prior SAR, the extreme point (EP) and the acceleration factor (AF). The last two values make this indicator distinct. The extreme point represents the highest price during an upward trend or the lowest price during a downward trend. While the accelerating factor increases by 0.02 (2%) after the new price high or low appears. The parabolic SAR formula is as follows:
In an upward trend: Parabolic SAR = Prior SAR + Prior AF (Prior EP – Prior SAR)
In a downward trend: Parabolic SAR = Prior SAR – Prior AF (Prior SAR – Prior EP)
You can adjust certain values, called “step” and “maximum” on your trading platform. Step means the acceleration factor. By default, the value is 0.02 with a maximum value is 0.2 (20%). You can change and adapt the setting according to your trading strategy. Keep in mind though, that a higher acceleration factor will make the Parabolic SAR indicator more sensitive. Wilder suggests that the 0.02 steps will provide the best results. Alternatively, lower values for the accelerating factor will decrease the sensitivity.
How to trade with the parabolic SAR indicator
Traders use the parabolic SAR as a point where they place trailing stop-loss orders because a price movement away from the signal may indicate a potential reversal.
- When you see the dots below the candles it is a buy signal. A buy alert can also be noticed when the closing price crosses the parabolic SAR point, which has been above the candlesticks
- A sell signal occurs when the dots are above the candles. Accordingly, a more precise signal can be determined when the closing price crosses below the lower parabolic SAR
- You can identify potential reversal signals when the parabolic SAR moves from being below the price bars to above the price bars, and vice versa
- Traders may place trailing stop-loss orders at the parabolic SAR points
When you define your parabolic SAR trading strategy, it’s a good idea to use it simultaneously with other trading strategies and incorporate other technical indicators to help you confirm the trading signals. You can use the parabolic SAR indicator with the average directional index, moving averages and relative strength index.
You can see an example of the way parabolic SAR acts during ranging market conditions and potential buy and sell signals in the graph below.
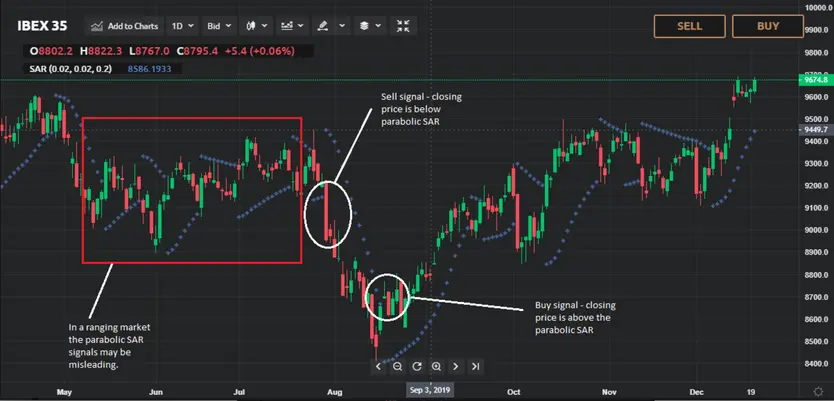
On the left side of the graph, in the area in the red rectangle, you can see how parabolic SAR looks during sideways price movement. The signals are weak because the indicator constantly moves above or below the price.
The right side of the graph shows the indicator during a downward and then an upward trend. A sell signal is identified in the higher white circle when the price closes below the parabolic SAR point. The lower circle shows a buy signal when the closing price is above the downward trend SAR.
Advantages of the parabolic SAR trading indicator
- It’s a useful indicator when you want to determine the price direction
- It can offer signals that help traders to collect their profits when trend reversal appears
- Parabolic SAR helps traders increase profits as they exit at the right moment
Disadvantages of the parabolic SAR trading indicator
- Although highly useful in trending markets, it can provide false signals during a ranging price movement when a trend cannot be determined;
- Using the parabolic SAR during swift up and down price movements can result in false signals. The indicator may be used for assets with steady price changes;
- The indicator doesn’t provide in-depth information about the trend strength since it doesn’t incorporate the trading volume.