The Stochastic RSI is a useful tool for traders. We show you how it works and how to use it.

Contents
- What is the Stochastic RSI?
- How to calculate the Stochastic RSI
- How to read the Stochastic RSI
- Drawbacks of the Stochastic RSI
The Stochastic RSI indicator, also known as the Stochastic Oscillator, is one of a range of data tools that can be used to measure how strong a market is. It is an oscillator, meaning that it consists of a line that moves up and down and helps traders work out if something is overbought or oversold. Here, we tell you how it works, what it does and how to use the Stochastic RSI.
What is the Stochastic RSI?
The Stochastic RSI indicator was created by Tushar S. Chande and Stanley Kroll. The idea behind it was published in the book The New Technical Trader, which came out in 1994. Although there were already indicators that showed whether something was overbought or oversold, the Stochastic RSI was designed to combine the formula used in the Stochastic Oscillator with the values of the Relative Strength Indicator (RSI).
The idea behind stochastics is that when you are trading stocks, if something is trading upwards, then the close price is usually comparatively close to the intraday high. Likewise, if something is trading downwards, then the close price will usually be comparatively close to the intraday low.
The RSI is used to measure the size of recent price changes to see whether something is overbought or oversold.
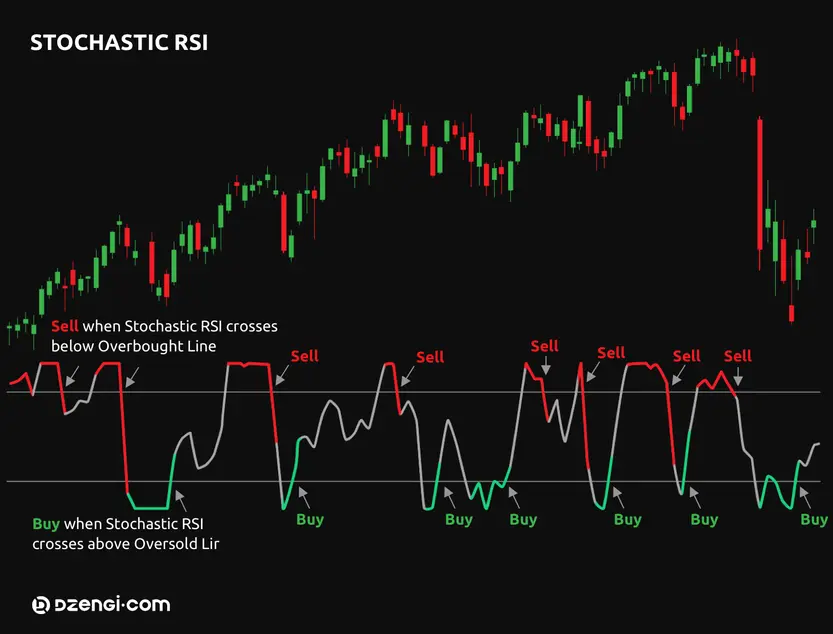
The indicator itself measures a value between 0 and 100. As a rule of thumb, if it is measuring below 20, then that means the stock is trading towards the bottom of its range and might well be oversold. If it is measuring above 80, then it is trading towards the top of this range and might well be overbought.
It is worth mentioning that just because something is overbought or oversold, that does not necessarily mean the market is about to change course. We can simply assume that things have gone further than they should have, quicker than they should have.
Although traders can use the Stochastic RSI to see if a commodity is overbought or oversold, it can also be used to look at short-term trends. If we look at the midpoint of the indicator, the 50 mark, and the Stochastic RSI is above that, then trends are probably moving upwards; if it isn’t, then trends are probably moving down.
There is also the matter of divergence. If we marry up the main chart with the Stochastic RSI indicator and we see that, for instance, the price itself has hit a high and the Stochastic RSI has not, that indicates we might see divergence. This can lead to retracement, where the price bucks against the overall trend. If this happens, it can lead traders to take it as a signal to either buy or sell, at least in the short term.
There are two lines in the Stochastic RSI. There is the K line, which is basically a current measure, and the D line, which is a moving average of the most recent three periods.
How to calculate the Stochastic RSI
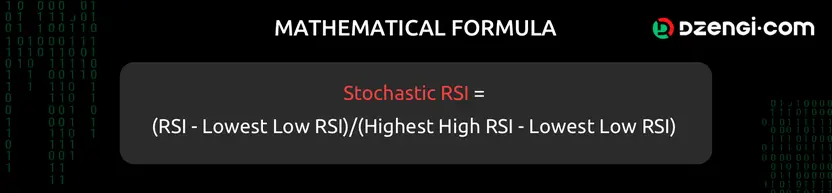
If we want to calculate the Stochastic RSI, we have to take a look at the relative strength index itself. We take the current measure of the RSI and then we take the lowest it has been in the last 14 periods. Then we take the highest the RSI has been in the last 14 periods and subtract the lowest point from that. Then we divide the first number by the second one and we have the Stochastic RSI.
The Stochastic RSI formula looks like this.
How to read the Stochastic RSI
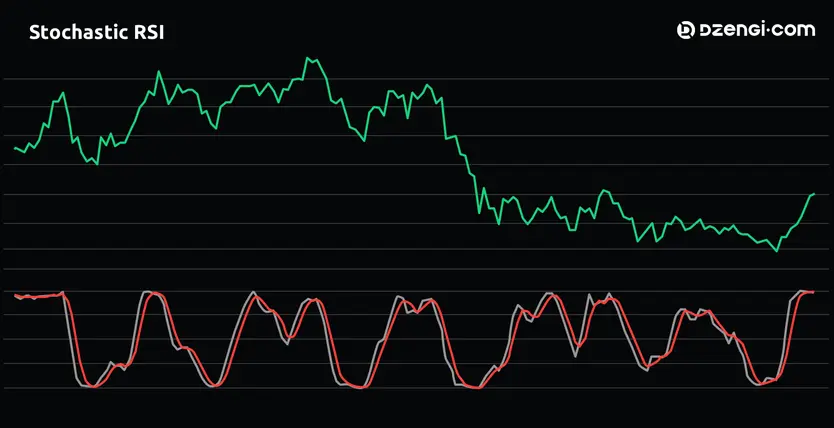
If we look at these charts, we can see the Stochastic RSI indicator at the bottom. The blue line is the K and the red line is the D. The D is smoother and lags behind the K. We can see the buy signals when it goes through the bottom line and sell signals when it goes through the top dotted line. We can also see that there are times when the lines cross over, meaning that there is about to be a reversal, and there are even times when the main price index does something the Stochastic Indicator isn’t doing, which means there’s the potential for divergence.
Drawbacks of the Stochastic RSI
While the Stochastic RSI is useful, it is not infallible. As with all systems, there are drawbacks. For instance, the Stochastic RSI is good at telling us what has happened and what is happening right now, but it cannot tell us what is going to happen in the future. There is always the possibility that it can deliver false signals, especially when used alone. Traders who use a Stochastic RSI trading strategy will generally use a variety of measuring tools to get a bigger picture.
If you want to use the Stochastic Indicator, you should remember that the prices of stocks can go down as well as up, and never invest more than you can afford to lose. You should do your own research and use a variety of tools for market analysis, rather than just one.