This technical analysis tool is used to determine periods when the security is overbought or oversold or as a trend confirmation tool

Contents
- What is Envelope Indicator?
- How to read the Envelope Indicator
- How to use the Envelope Indicator
- Limitations of the envelope indicator formula
What is Envelope Indicator?
Envelope or envelope channel is a technical trading indicator that is used to identify trading ranges, to confirm a trend or overbought and oversold periods. It is considered to be a trend and a lagging indicator. The idea behind this indicator is that the price has the tendency to remain within a certain range during normal market conditions. However, when these conditions are changing the price has the potential to move above or below the envelope bands, which signals possible trading positions.
How to read the Envelope Indicator
An envelope bands calculation is usually done using moving averages where the simple moving average defines the upper and lower envelope, but traders can also use an exponential moving average. The envelopes are plotted by setting the bands at a certain distance above and below the price. The formula for calculation of the envelope bands is:
Upper band or envelope = SMAN + (SMAN x D%)
Lower band or envelope = SMAN - (SMAN x D%)
Here SMA represents the simple moving average, N represents the number of periods used for the moving average and D is the deviation value which assigns the distance of the envelopes from the moving average. Traders can set the distance based on their trading strategy or personal belief and preferences. For instance, the calculation of the envelope for 25-day SMA and a 3% distance or envelop is as follows:
Upper band = 25-day SMA + (25-day SMA x 0.03)
Lower band = 25-day SMA - (25-day SMA x 0.03)
During periods of increased volatility or for assets with high volatility, traders should set a higher distance value or deviation percentages to avoid whipsaw. Accordingly, you will define lower deviation percentages for instruments with low volatility.
You can easily plot the envelope channel on your chart by selecting it from the list of available indicators. Keep in mind that you should set the percentage value for the desired distance, and also you can change the number of moving average periods. The following graph provides an overview of how an envelope indicator would appear on your chart.
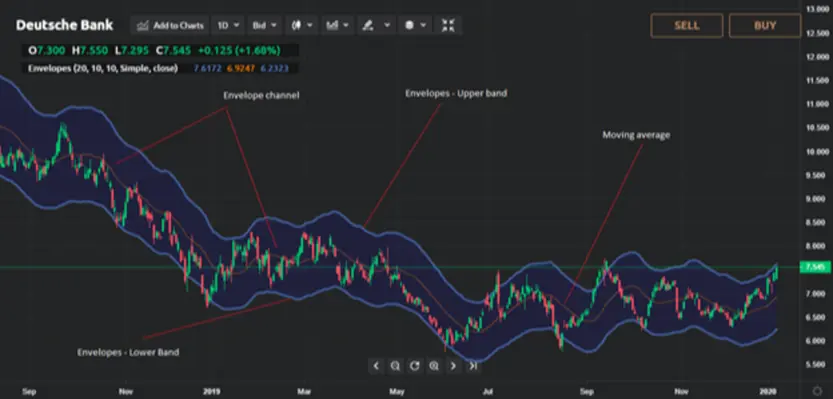
When you apply the envelope indicator, you will notice two lines or bands which appear above and below the price and these lines are called upper and lower envelopes. Also, the area between the bands represents the channel (the blue area). The line within the channel means the simple moving average. You can see that the bands move in parallel with the simple moving average because the distance away from the moving average is constant.
How to use the Envelope Indicator
The application of the envelope trading strategy depends on whether you are trading short term or you want to invest in the long run. Usually, traders set shorter moving averages with narrow deviation values while investors select a higher number of periods for the moving average with much broader distance. Although different traders have their own way in which they use the envelope to try to identify specific patterns, the common application of the indicator is to provide certain alerts, such as overbought or oversold, sell and buy signals or as a trend confirmation.
A sell signal may appear when the asset price crosses above the upper envelope. Traders can sell the instrument at a price above the upper band and close their trading position once the price falls within the trading range, i.e. between the two bands. A buy signal occurs when the price crosses below the lower envelope. Traders may enter a long position by buying the underlying asset at a price outside of the lower band and terminate the position when the price moves back within the envelope bounds.
Overbought conditions are identified when the price touches the upper band of the envelope. Traders should consider entering a sell position because a decrease in price can be expected. Oversold conditions are detected when the price reaches the lower band of the envelope, which is an indication of a potential buy alert.
Since the envelope indicator is based on the moving averages, it does reflect some of the characteristics of this indicator. Namely, because the moving averages are used as trend confirmation and trend following indicator, traders use the envelope in a similar way.
The directional movement of the envelopes can reveal information about the trend direction. An upward direction of the envelops would confirm a bullish trend, while a downward slope will portray a bearish movement in the trend.
Traders can identify alerts for the potential formation of a new trend or changes in trend direction by looking at the price and the envelope bands. A new trend can be detected when the price breaches and remains for specific periods above the upper envelope or below the lower envelope displaying potential upward or downward trend respectively. The following graphs show possible sell and buy signals identified with the envelope channel indicator along with trend confirming alerts.
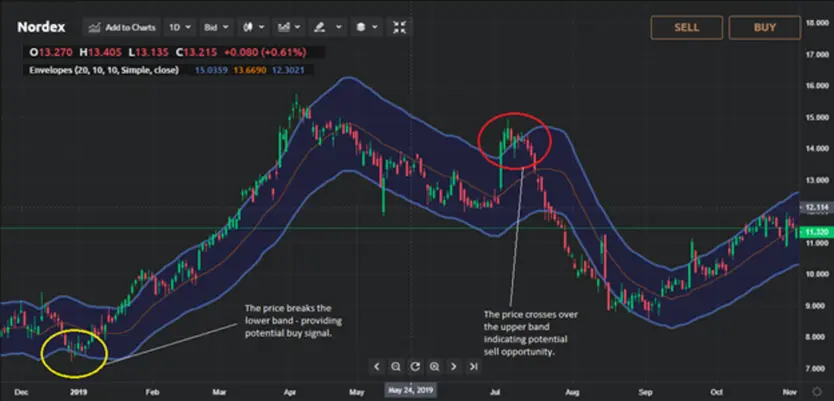
The graph shows you how to identify potential buy and sell opportunities and how the envelope indicator would look. You can see that at the yellow circle, the price crosses below the lower band, which signals that traders can open a long position. After the price has broken the lower band, it changes direction and starts moving upward.
The red circle displays a potential sell signal when the price crosses above the upper envelope band. You can see an example of the possible trend confirmation signal in the next graph.
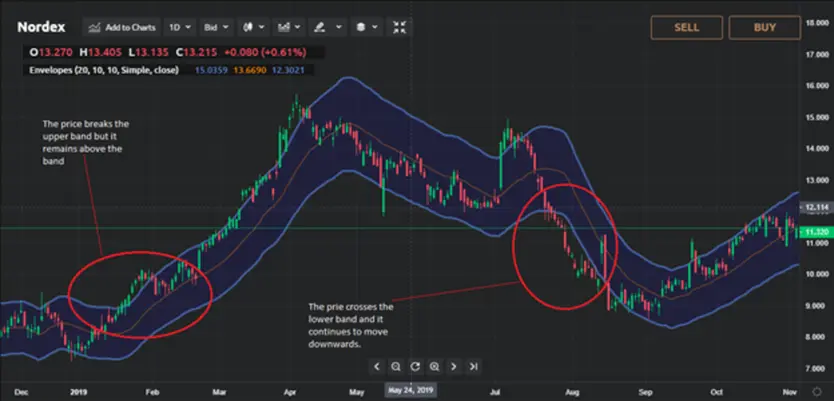
At the areas marked with red circles, we can see how potential trend confirmation alerts would look, but keep in mind that the pattern can be different for different instruments. However, at the left side of the graph, we can see that the price moves outside the upper band and continues in the same direction while at the same time the bands also move in the upward direction, thus a trend is confirmed. The area marked with the red circle on the opposite side of the graph is pointing toward a downward trend when the price moves beyond the lower band and remains outside the envelope channel for a certain period.
Traders commonly use the envelope indicator in combination with other indicators and technical analysis tools, such as MACD, RSI or Bollinger Bands, volume indicators and price action, to confirm their trading alerts. You can also plot multiple envelopes by setting different deviation percentages from the simple moving average to confirm certain signals produced by the envelope indicator.
Limitations of the envelope indicator formula
As with any other indicator, the envelope indicator formula comes with certain limitations. Namely, one advantage of the envelope indicator is that the trading range is quite easy to comprehend and trading signals can be easily identified. Traders can use the indicator as a tool to detect potential overbought and oversold conditions.
However, the indicator can be criticised because the distance percentage should be adapted following changes in the volatility as a means to limit potential whipsaws. Also, the envelope channel may provide more accurate alerts when plotted for higher time frames.
