The ADX indicator is used by traders to determine whether a trend is strong or weak

The average directional index (ADX) is part of the Directional Movement System established by American technical analyst Welles Wilder. Originally, it was intended primarily for use with commodities, but it can also be applied to other trading instruments.
The ADX is used for determining the trend strength irrespective of its direction, which is defined by the components of the Directional Movement Index (DMI). Therefore, the ADX indicator is often used in conjunction with the Directional Movement Indicator, which consists of the positive directional indicator (+DI) and the negative directional indicator (-DI), which are also components of the ADX calculation process.
Although ADX can provide alerts for potential entry or exit points, it doesn't determine the type of position you should open (buy or sell) by itself, because it can’t anticipate the trend direction.
As an oscillator indicator which tracks market fluctuations, ADX moves in a range from 0 to 100 and you use the value of ADX to determine how strong the current trend is. Wilder points out that a strong trend can be expected when ADX has a value above 25, while during a weak trend, ADX will be below 20.
Alternatively, depending on the instrument or the market, you may consider a trend to be strong when ADX is above 30, above 50, and so on. You’ll need to figure out which ADX value will work best for your trading style or the selected asset.
The index usually takes the form of a line moving within the given range at the bottom of your chart, and it will be shown with three lines when you use it in combination with the +DI and -DI. Depending on the trading platform, you can also plot the indicators as an area, histogram, columns, etc. Additionally, the three lines can be shown as a separate box.
The default setting for the ADX is usually 14 periods, but you can change the configuration and choose other time frames.
The average directional index calculation
Average directional index calculation is based on a couple of steps. These involve the calculation of the directional movement indicators (both positive and negative), and calculation of the true range with a moving average or other method selected by the trader (suggested by Wilder).
The last step in the calculation of ADX refers to the smoothing technique used to find the associated indicator values. The following ADX formula is applied:
ADX = Moving Average x (|DI (+) - DI (-) | / (DI (+) + DI (-)) x 100
or
ADX = Exponential Moving Average x (|DI (+) - DI (-) | / (DI (+) + DI (-)) x 100
Wilder also suggests other smoothing techniques that could be applied during ADX calculation, such as a moving average or exponential moving average.
How to use ADX
Market conditions play a crucial role when defining your trading strategy and the types of technical analysis indicators and tools you apply. Consequently, you can use the average directional index to determine and confirm trending or range-bound market conditions. If you are a trend trader, the ADX indicator will be helpful for eliminating assets exhibiting range-bound conditions.
Since ADX is used to identify the strength of the trend, it’s better to use it with the directional movement indicators to determine the direction of the trend and buy or sell signals. Traders identify signals based on the DI crossovers strategy:
- When +DI crosses above -DI, it signals that the price will move upward and the trader should consider a buy position
- If -DI crosses above +DI, you can expect that the price will move downwards and a sell order should be placed.
During ADX trading, you can also watch for potential signals of a possible breakout from a ranging market. Wait for the ADX indicator to start moving above 25, but this doesn’t mean that you should immediately open a trade position: try and see if the trend strength will continue to rise.
ADX can also be used when you look for potential moving average crossovers, or when the shorter moving average crosses over the longer period moving average. The average directional index can be used as a way to confirm the strength of a trend for a buy or sell crossover signal. Identifying a crossover signal while the ADX a has value above 30 indicates a continuance in the trend direction.
Aside from the moving averages, you can combine the ADX with indicators such as the Fibonacci retracement, stochastic oscillators, Parabolic stop and reverse system (SAR), relative strength index (RSI) and so on.
The average directional index indicator can also be combined with momentum indicators to identify whether the trend will be bullish or bearish, such as the Positive Directional Index (+DI) and the Negative Directional Index (-DI).
Average directional index indicator example
You can see how the ADX indicator looks when plotted on your chart by itself, or when it is set up with the positive and the negative directional indicators to identify crossovers. Another example offers an insight into the possible application of the average directional index, in terms of how you can distinguish between a range-bound or trending condition.
Let's start with an overview of how the average directional index indicator will look when plotted on a chart.
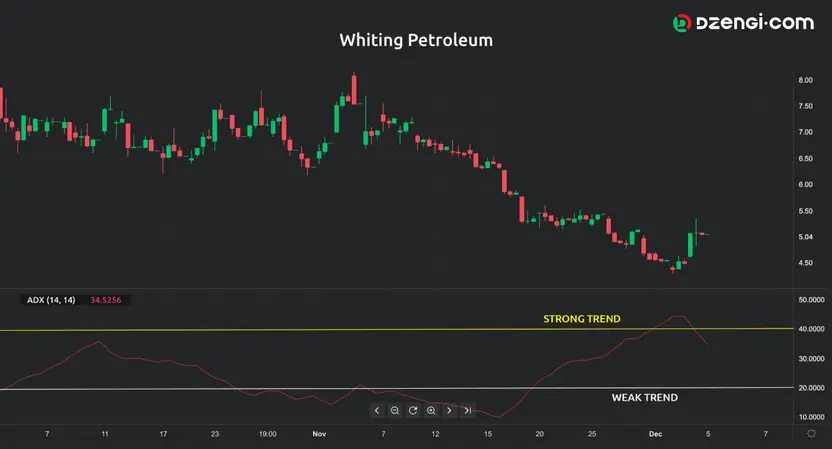
The red line at the bottom of the chart represents the ADX indicator and you can see that a weak trend is identified when ADX has a value of below 20 (below the white line). Alternatively, a strong trend is emerging when ADX has a value above 40 (the yellow line).
An example of a combination of bullish and bearish DI crossovers, together with an ADX and +DI and -DI setting, is presented in the following graph.
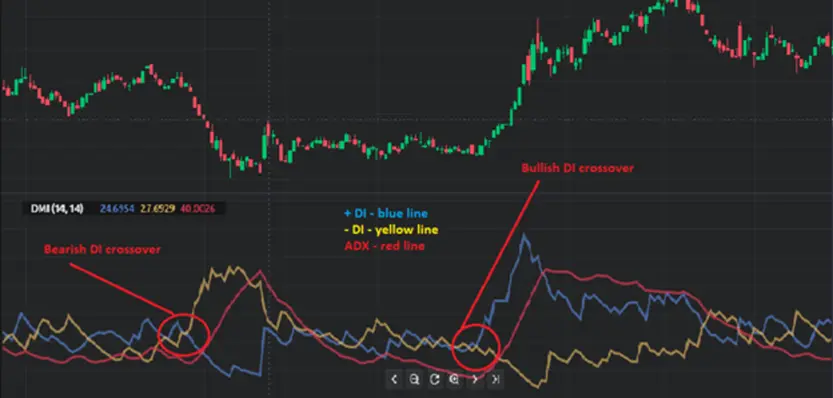
On the left side of the graph, you can see that the negative DI (yellow line) crosses above the positive DI (blue line), signalling a bearish price movement. Conversely, to the right, a bullish crossover is found when the positive DI crosses above the negative DI, which alerts for an upward price movement.
An example of how you can use the ADX indicator to identify the type of market condition is presented in the next graph.
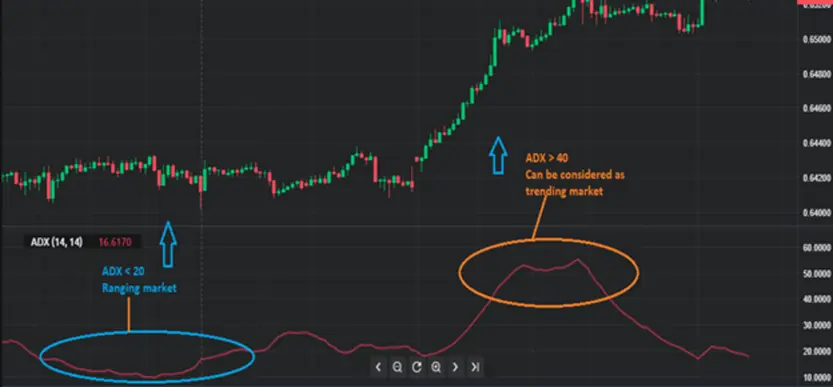
On the graph, you can see that on the left side, the ADX value is below 20, signalling a ranging market. At the end of the ranging market period, ADX progressively moves upward, reaching values above 40, which is an indicator that there is a strong trend.
Benefits of the ADX indicator
• Simple and easy to understand indicator when you want to examine the price or trend strength
• ADX makes it possible to enter a position earlier, depending on the chosen ADX value. A higher value could mean entering the trade later
• You can easily identify whether a market is ranging or trending, which is crucial when setting up your trading strategy.
Limitations of the average directional index
• Although you can enter early, you can also experience whipsaws (or sudden pivots in price trends) prior to making any profits from entering ahead of waiting for a support or resistance alert. The indicator levels you have chosen for your ADX trading will have an impact on the whipsaw effect
• The DI crossover strategy can provide you with a profitable trading opportunity, but it can also generate false signals, especially during increased volatility, because the two DI lines will often crossover within a short period
• As an average indicator, it may take some time before ADX reacts to changes – there could be a certain lagging behind the price.