Bollinger Bonds are valuable tools to help a trader enter, exit, place stop loss orders and even spot when a potential breakout might occur
Developed by market technician John Bollinger in the 1980s, Bollinger bands are popular trading indicators and are an important tool in the trader’s arsenal.
Used properly, they can provide market volatility information, trends and even indicate if a potential breakout could occur.
Looking at a 20-day moving average in the chart below, we can see two trading bands have been added, one above and one below. These are the Bollinger bands.
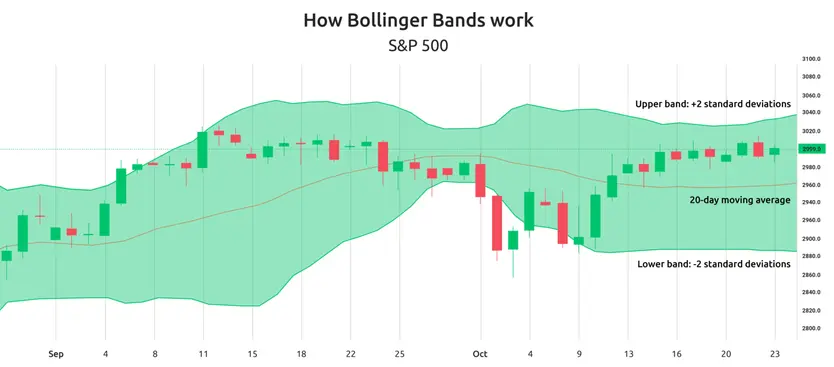
Bollinger bands are typically placed two standard deviations away from the 20-day moving average, and this statistical concept describes how prices are dispersed around an average value.
Using two standard deviations ensures that 95pc of the price data falls between these two bands and makes any movements outside the bands significant.
Price volatility
As standard deviation is a mathematical formula that measures volatility, the Bollinger bands show us the price volatility of the market we are looking at.
This means the bands will adjust themselves according to what is happening to the moving average; getting closer to the average in times of low volatility and expanding when the market sees bigger swings.
We can therefore quickly see what has happened in the past 20 days regarding price volatility by observing the expansion and contraction of the Bollinger bands.
Bollinger Bands trading strategy
How to use Bollinger Bands
When we see a sideways shift in the moving average, the Bollinger Bands contract and squeeze in, indicating low volatility. A trader may choose to buy at this point, anticipating a big rise in price when volatility increases.
When the market picks up and we see periods of high volatility, the bands widen. As we know the bands hold 95pc of the price data, when the price approaches the upper limit of the band, the trader may choose to sell, to maximise gains.
Bollinger Bands are therefore useful indicators of market volatility.
Overbought strategy
Bollinger Bands are popularly used to spot overbought and oversold market conditions.
An asset can be considered to be overbought when it is trading at a high price – indicated by the price hitting the upper Bollinger band. As the chances of the price going up further are low, a trader may choose to sell, as the price is likely to drop back down to the moving average.
Oversold strategy
In the complete reverse, we can consider assets to be oversold when the price drops low enough to reach the lower Bollinger Band. As the price is unlikely to get any lower traders may choose to buy, in the hope of making money when the price bounces back up to the moving average band.
Breakout indicator/squeeze strategy
One interesting use for Bollinger Bands is as a tool to spot potential breakouts.
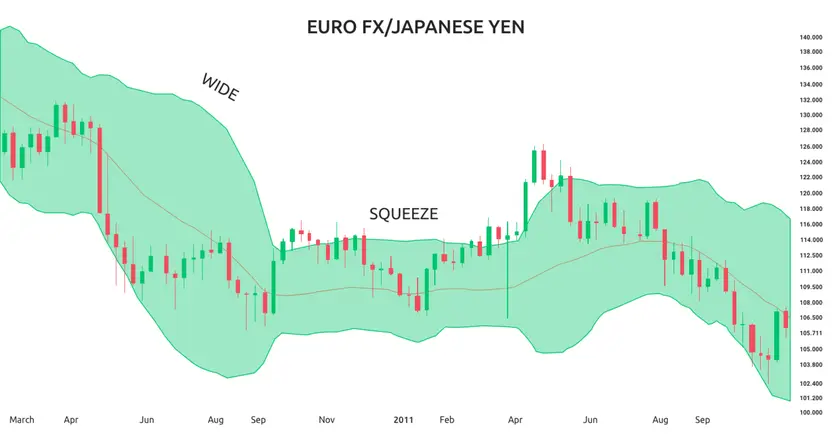
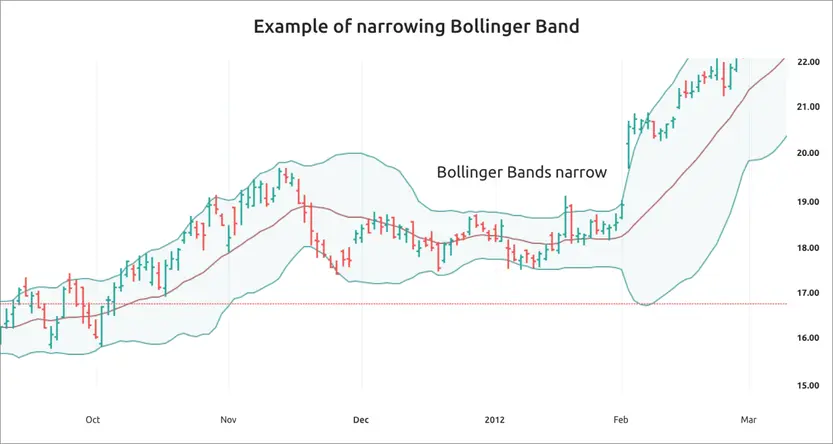
When we enter long periods of low volatility, the Bollinger Bands will tighten and squeeze into almost a “sausage” shape around the market average.
If the price is contained below this resistance level or above the support level for long enough a “breakout” can occur – the price can literally break out above or below a Bollinger Band in an explosive move that could even cause the chart to start trending in this direction.
Many traders watch for this shape in Bollinger Bands as it might just predict an imminent breakout and the trading opportunities that could offer.
Standard deviations
While Bollinger Bands are typically positioned two standard deviations away from the market average, this doesn’t have to be the case. If three standard deviations are used this tends to indicate the market is over-stretched.
Observe market trends
Bollinger Bands are a statistical tool and, while useful, they can only provide so much information and should be used in conjunction with other tools.
For example, while it might seem prudent to sell when you see the price approach the top of a Bollinger Band, you could pay a heavy penalty if the market is in an upward trend with prices climbing even higher, and vice versa.
But on the other hand, Bollinger Bands can be used to ride trends.
When planning to trade in a trend it is difficult to know when to enter or exit the market as the price keeps rising or falling.
When the prices are trending upwards, they tend to rise up towards the upper limit of the Bollinger Band, then fall back down towards the average, before repeating the process in an upward direction.
By choosing to enter the market when the price has fallen towards the average, a trader can effectively trade with the trend. This process can be utilised in reverse for falling markets.
Bollinger Bands trading
Bollinger Bonds can be used as helpful tools to indicate to a trader when to enter, exit, place stop loss orders as well as spot overbought/oversold conditions and even when a potential breakout might occur.
Use in conjunction with other tools
But there are no guarantees that the market will do what you might expect, even when using statistical tools such as Bollinger Bands. As with all trading techniques , to be really effective the trader must use them in conjunction with other tools (such as candlestick charts) as well as the all-important gut instinct and common sense.