The standard deviation indicator is a simple-to-use technical analysis indicator, which measures the dispersion of the closing prices from the mean closing price

Contents
- Why standard deviation is important
- What is standard deviation indicator?
- How to read standard deviation
- The standard deviation indicator formula
- How to use standard deviation
- Why standard deviation is used
Standard deviation is a technical indicator (it can also be labelled as StdDev or SD) used by traders to measure the price volatility of an asset, or the difference between the actual closing price and the average price.
Why standard deviation is important
SD is used by traders to recognise the magnitude of recent price changes to estimate the volatility of an asset. It can be utilised as a tool to measure future price volatility.
What is standard deviation indicator?
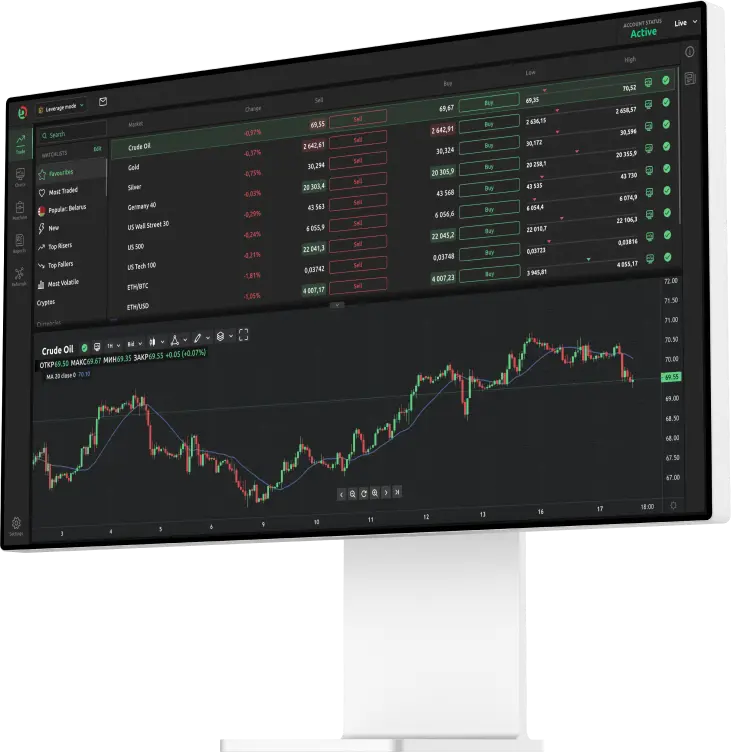
The indicator is located in a box at the bottom of the chart in the form of a line. The default set up can be for 20 or 14 periods, depending on the trading platform. However, you can change this set-up based on your strategy.
How to read standard deviation
When the standard deviation is high, meaning that the actual price is further from the average price, it is a sign of higher price volatility. On the other hand, you can see low volatility when the actual price is close to the average price. Consequently, a low volatility market can be characterised as a flat market.
The standard deviation calculation is based on a few steps:
- Find the average closing price (mean) for the periods under consideration (the default setting is 20 periods)
- Find the deviation for each period (closing price minus average price)
- Find the square for each deviation
- Add the squared deviations
- Divide the obtained sum by the number of deviations
- You can finally calculate the standard deviation as the square root of the value arrived at in the previous step.
The standard deviation indicator can have different values for different assets, and a higher value for standard deviation is not related to the level of volatility. The value of standard deviation is associated with the asset price. Therefore, an asset with a higher value should not be identified as more volatile.
The standard deviation indicator formula
Some traders use the standard deviation indicator as a standalone indicator in their analysis but it is commonly used in combination with other indicators. It allows you to simultaneously analyse different aspects of the price and confirm their potential trading signals. Standard deviation is applied in conjunction with other indicators such as trend, volume or momentum indicators. It means you can combine a standard deviation indicator strategy with tools including the Relative Strength Index, moving averages and Fibonacci retracement.
The standard deviation indicator is also a component of other indicators such as Bollinger Bands, where it is added to the moving average. Standard deviation as a constituent of the Bollinger Bands indicator is used to define the upper and lower bands.
How to use standard deviation
The standard deviation indicator can be a useful tool when you want to trade a breakout or determine price reversals. Reading the signals provided by the indicator depends on whether the price displays high or low volatility. Consequently, there may be the following alerts:
- When the market has a low standard deviation, indicating low volatility or inactive market, then a breakout (price spike) may emerge.
- If the standard deviation is high, signalling a high volatility market, then a decrease in activity level is expected.
Aside from the alerts provided from high/low volatility, you can determine signals based on the relation between the price tops and bottoms and the associated volatility level. Therefore, when you identify the tops or bottoms, you can read the following signals:
Maturing bull market (market tops/decreasing volatility) – using longer time frames, you can determine a maturing bull market if the price tops are identified together with low volatility.
Hesitating traders (market tops/increasing volatility) – circumstances in which you have identified market tops along with higher volatility for a short period, signals that traders are hesitating.
Lack of traders’ interest signal (market bottoms/decreasing volatility) – through long periods, a price bottom and low volatility signal potential lack of interest for the specific asset.
Panic sell-off signal (market bottoms/increasing volatility) – this signal can be identified when market bottoms are conveyed with high volatility during short time periods.
If you include the indicator in your trading strategy, try to identify price tops or bottoms because it will signal that the price might move back toward the mean value. Don’t forget that there is a certain risk involved when you open a position. You can use the standard deviation indicator to place a stop-loss and limit your exposure.
Why standard deviation is used
-
It’s a simple technical analysis indicator;
-
It can be used when you want to anticipate price volatility and you want to know whether volatility will increase or decrease;
-
The indicator may be used to examine potential expectations about market behaviour because you can differentiate between an active and a flat market;
-
You can determine potential reversals in price;
-
It is based on the principle that prices will reverse back to their mean value. After an extreme price movement, traders expect that the price will move towards the mean and they can plan their trading positions accordingly.


