The VWAP indicator is another useful tool for traders. Here we tell you all about it.

Contents
- What is the VWAP indicator?
- How to use the VWAP indicator
- How to calculate the VWAP indicator
- How to read the VWAP indicator
- The drawbacks
What is the VWAP indicator?
VWAP stands for Volume Weighted Average Price. The VWAP indicator is one of a range of technical analysis tools that can be used to measure how a security is doing. More specifically, it gives the average price the security has traded at over the course of a day.
The VWAP Indicator is used by traders to measure how well a stock is doing in comparison to a benchmark figure, which will hopefully give them enough information to help them decide whether to buy or sell it.
How to use the VWAP indicator
What makes the VWAP indicator a useful tool for traders is that it allows them to see what has happened throughout the day’s trading. At the end of trading, if they bought the asset at a price below the VWAP line, they will have bought it at a good price. If they bought it when it was above the VWAP, then they may have overpaid.
The VWAP indicator is worked out each day. The data included in it starts at the same time trading starts and it ends when trading closes.
The first time the VWAP indicator was used in business was in 1984, when it was implemented for the Ford Motor Company by James Elkins, then head trader at the analytics firm Abel Noser. It became more popular in the 1990s when traders found that trading around a VWAP indicator strategy was comparatively safe. People were not going to win big using it, but the general perception was that it could help people avoid making bad losses.
How to calculate the VWAP indicator
First, you look at the data within the first five minutes of the day's trading. You add the highest figure, the lowest figure and the closing figure, and then divide this sum by three to get an average. You then divide that average by how many stocks were traded throughout that period. This figure gives you the VWAP. You will then continue repeating this procedure throughout the day.
If you want it done clearly, the VWAP indicator formula looks like this:

How to read the VWAP indicator
The indicator itself is pretty simple. It’s shown as a line on a chart, and when the price is above that line, that means that the stock is probably on an uptrend; when the price is below the line, it means the stock is probably on a downtrend.
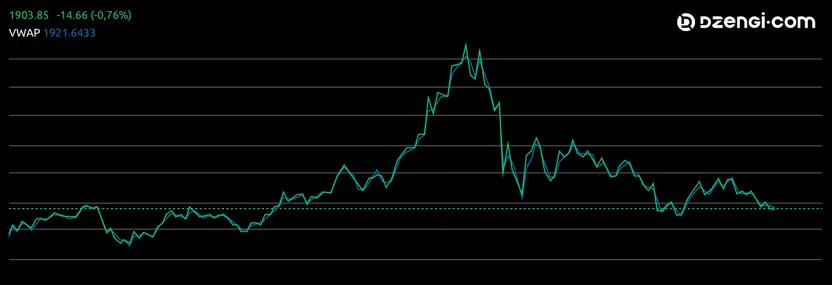
- VWAP chart 1

If you look closely, you can see a smooth blue line next to the jagged green price line. This smooth line indicates the VWAP.
So we can see there are times when they don’t quite match up; this is when we can tell trend patterns are forming. For example, here the VWAP indicator is close to the actual price. This illustrates how the VWAP indicator can help deliver safe returns, at least theoretically.
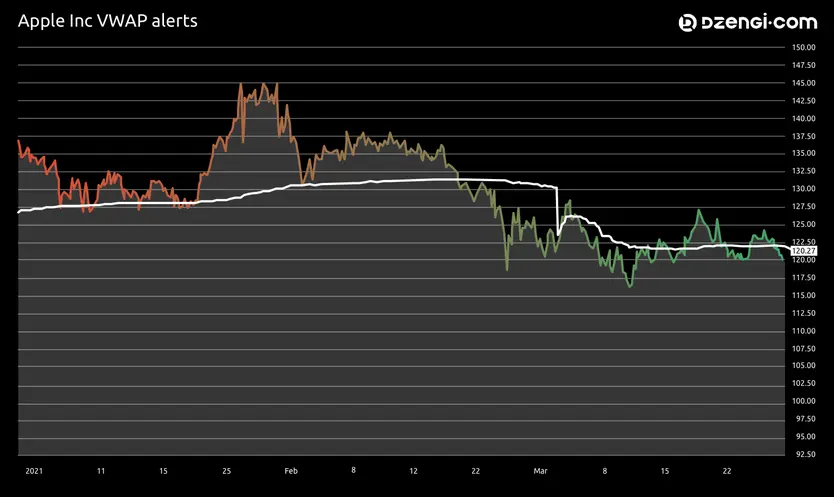
- VWAP chart 2

In chart 2, we can see that, at the earliest part of trading, the stock is on a strong uptrend, but then it moves to a downtrend as time goes on.
The drawbacks
While the VWAP indicator is a useful tool for short-term and single-day trading, it is not perfect, particularly for longer-term work.
If you try to calculate VWAP using the indicator too frequently over a number of days, it can distort the data, and you may end up seeing misleading figures.
There is also the matter of what happens during strong long-term trends. If an upturn lasts for a long period, you may not see the price falling below the VWAP indicator, which could mean some traders will miss out on opportunities.
Finally, the VWAP indicator only tells part of the story. If you want to make use of a VWAP indicator strategy for trading, it is probably a better idea to use it in conjunction with other indicator tools so you will get a more detailed picture of where the market is.
As with all indicators, the VWAP indicator is good at telling us what has happened and what is happening, but it cannot predict the future.
When it comes to investing, you need to do your own research. Remember that prices can go down as well as up, and never invest more money than you can afford to lose.


