If you want to learn how to read and use the candlestick chart, this piece should help

The candlestick chart, also known as the candlestick indicator, is a method of creating a graph which not only reflects a commodity’s price, but also its movement of travel. It is a very common method of looking at prices and trying to ascertain trends. It is one of the oldest price charts in existence and was created in the 18th century by Japanese merchant Munehisa Homma. In this article, we will tell you what it’s made of, we’ll answer the question ‘how do candlestick charts work?’, we’ll tell you how to use it and, hopefully, have the candlestick chart explained for you.
What is a candlestick chart?
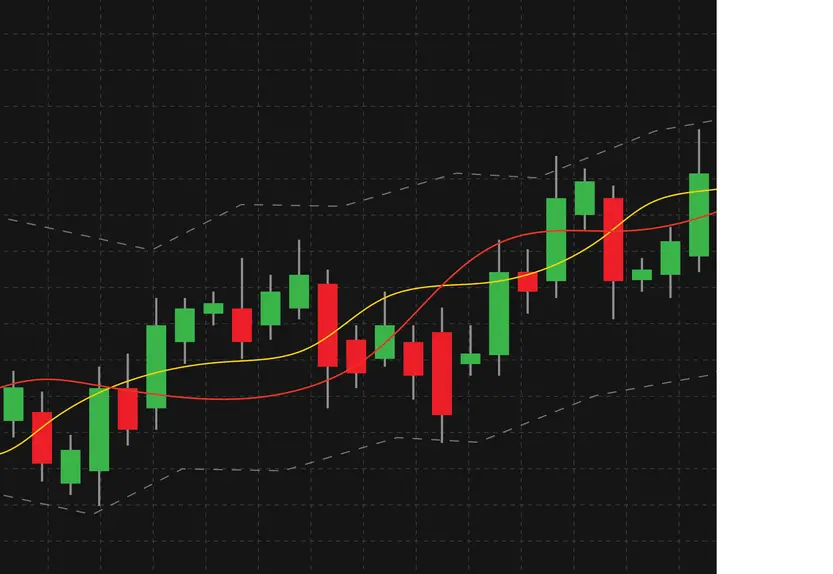
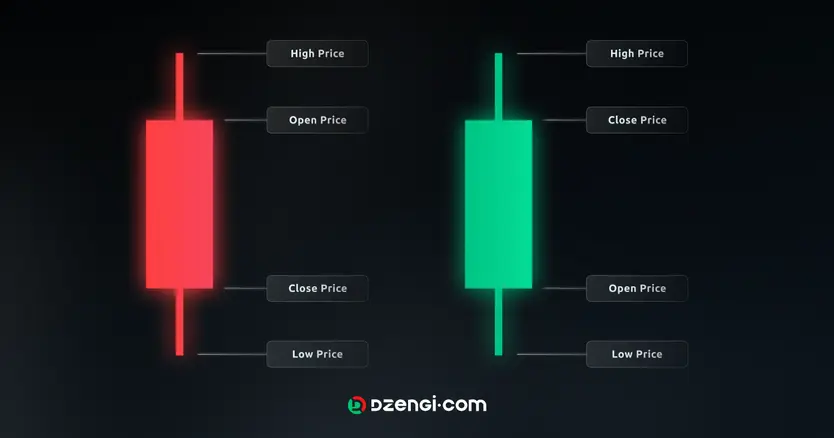
A candlestick chart is a chart which measures the movement of price over time. If you look at it, you will see that, rather than having a traditional line moving to reflect the price, there are elements of different colours and sizes. Sometimes the elements are red and green, sometimes they are filled and hollow. These individual elements are called candles, due to their tapered appearance. The thick bar section is called the body. The lines that extend above and below each body are called wicks or tails, depending on whether they are above or below the main body. The top of the wick represents the intra period high, while the top of the body represents the price at the start of the period. The bottom of the tail is the intraday low.
One thing to note is the colours of the candlesticks themselves. If the candle is either green or filled, then the bottom of the body represents the opening price and the top the closing price. This means that the price has gone up in trading hours. On the other hand, if the body is hollow or red this means the top is the opening price and the bottom is the closing price. This means that the price has gone down in the time being measured.

A trader might use a candlestick chart because being able to take a snapshot of how something performed over a set period of time. The other thing that is useful about the graph is how it lets you know if something is being bullish or bearish overall. A predominance of one particular graph colour will let you know what the current trend is.
How to calculate a candlestick chart
One thing to note about the candlestick chart is that, because it is a chart and not an indicator, there is no need to do any mathematical equations. You just find when you want to start recording a price, when you want to stop, and just get the start, close, high and low figures. There is no need to add, subtract, multiply or divide. There is no candlestick chart formula. You just want to make sure you have shaded it the right colour so people know whether a time period is bullish or bearish.
How to read a candlestick chart
If you want to know how to use a candlestick chart and how to read it, it’s relatively simple. You just move along the graph, noting where each individual candlestick has its highs and lows, and whether the stick is bullish or bearish.
There are some patterns worth noting. For instance if we have a large green candle coming after a small red one, then that suggests that the market has gone from being bearish to being bullish. In other words, more people want to buy than sell. If we flip the colours around, then that suggests that the market has gone from being bullish to being bearish. In other words, more people want to sell than buy. If a candle’s top is lower than the previous candle’s body, that suggests there could be more of the product sold and if it is higher, there could be more buyers.
If there is a large green candlestick, followed by three red ones that start high and go low but are all in the same price range as the green candlestick, then one that’s green and large, that suggests that things are on track to continue to rise. Reverse green with red and up with down, and you’ll see the bearish trend continue. Finally, if there’s a small red candlestick completely inside the previous time period’s large green candlestick, watch closely, because this signifies indecision – as does the same pattern with the colours reversed. This is also true if there’s what looks like a cross instead of a candlestick, which represents a time when the open and close prices are, if not identical, then very close.
The drawbacks
So that’s the candlestick chart explained for you. We do need to point out, though, that while candlestick charts are useful, they are not infallible. The chart is very good for telling us what has happened, but it cannot predict the future. You will need to study things closely and make your own decisions. Remember that prices can go down as well as up, and never invest more money than you can afford to lose.
Analysts have found as many as 63 different candlestick patters, although we have spoken about eight of the main ones above.
If you want to read a candlestick chart for day trading, you need to follow the motion of the trend, whether it is going up or down. You can also pay attention to the patterns described above. You will, however, need to be careful and remember that while a candlestick chart is good for telling you what has happened, it does not tell you what will happen. You need to do your own research and never invest more than you can afford to lose.


