The Aroon Indicator is a useful tool for examining trends. Here, we explain what it is and how to use it.

What is the Aroon indicator?
Looking at any market – whether it’s cryptocurrency, housing or traditional stocks and shares – it’s good to know what is happening overall and whether the market is trending up or down.
The Aroon indicator helps us to do that. Created in 1995 by Tushar Chande, an Aroon indicator measures the length of time between highs and lows over a given period of time.

The word ‘Aroon’ means ‘dawn’s light’ in Sanskrit. Chande chose the name because his indicator is designed to show people when trends start. It consists of two lines, one called Aroon Up and another called Aroon Down. Aroon Up measures how strong the uptrend is, and Aroon Down measures how strong the downtrend is.
How to read the Aroon indicator
The Aroon indicator is a way of looking at the strength of a trend. It is usually applied to data split into 25 periods,with the indicator showing how many periods it has been since a 25-period high or low. If you look at where the lines are in relation to each other, you can see where the market is trending. If Aroon Up is over Aroon Down, then the market is bullish and if Aroon Down is over Aroon Up, then the market is bearing. The start of a trend is shown by the lines intersecting.
The indicator moves between 0 and 100. A reading above 50 means that either a high or a low happened within the last 12 periods, depending on which line is higher. A score below 50 means that the high/low occurred within the previous 13 periods.
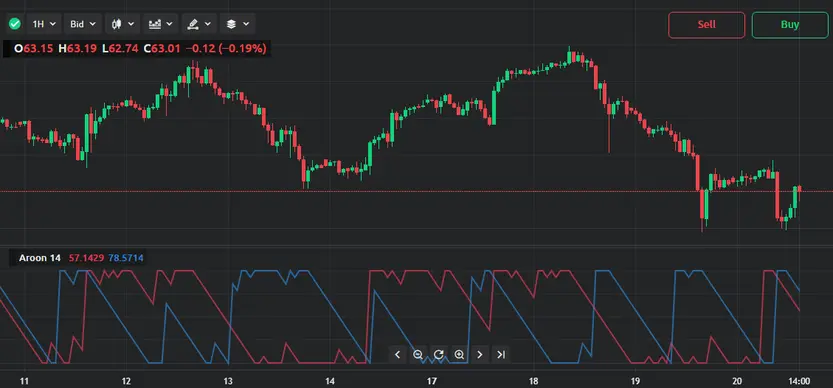
We can see the main chart at the top. Iif we look at the bottom half, however, we can see a red line and a blue line. The red line is Aroon Up, the blue is Aroon down. The first section shows Aroon Down on top for the majority of the time. This means that the market was trending upwards. However, just after that, there’s a large section with Aroon Up on top, so the overall trend was downwards. You can see the places where the two lines cross over each other, which is where a trend starts. At the end of the chart, Aroon Down is higher than Aroon Up, meaning the market shown in the chart is just starting a downwards trend.
If we subtract Aroon Down from Aroon Up, we get a figure called the Aroon Oscillator.
How to use the Aroon indicator
The Aroon Oscillator is calculated in the following way.

But how do we get Aroon Up and Aroon Down? Aroon Up can be found by counting the number of periods it has been since the last high and then subtracting that number from the total number of periods. You then divide the result of that calculation by the total number of periods before finally multiplying that figure by 100. We get Aroon Down by using the same formula, only this time you start with the number of periods since the last low.
Technically, the Aroon indicator formula looks like this:

The Aroon indicator’s formula might seem complex, but it does result in a chart that helps us to see how trends are growing and developing. This makes it a useful tool for traders who can use an Aroon indicator strategy for trading.
The downsides
However, while the Aroon indicator has its uses, it’s not perfect because it can only give retrospective information. A signal to buy or sell may occur too late, after a notable price move has already taken place. This indicator is a tool that can help us make predictions, but it doesn’t make them by itself. It looks backwards. Traders need to use other tools and their own knowledge to make forecasts.
It can’t predict any unexpected or unusual events that could disrupt the market, either. Nonetheless, it’s a useful tool that can be combined with others to help you analyse markets and highlight patterns in prices that might not be clear on a conventional chart.
FURTHER READING: How to read and use the Awesome Oscillator trading indicator
FURTHER READING: How to read and use the Commodity Channel Index trading indicator