The exponential moving average (EMA) smooths the effects of price changes by giving the highest significance to most recent prices

Contents
- What is exponential moving average?
- How to read the exponential moving average
- Exponential moving average example
- How to use the exponential moving average
- Advantages of exponential moving average
- Disadvantages of exponential moving average
- FAQs
What is exponential moving average?
Exponential moving average (EMA) is a technical indicator that differs from other moving averages in that its calculations give greater weighting to the most recent price data. It therefore gives importance to the most recent behaviour of traders.
This means the exponential moving average indicator can react much faster to changes in the price of an asset. Using EMA as part of your trading strategy is not limited to one specific instrument, and you can set up an EMA line for a variety of trading instruments.
How to read the exponential moving average
When it comes to an exponential moving average strategy, the most common periods used by traders in setting an EMA time frame are 50-, 100- and 200-day periods for the long-term line. The typical short-term time frames used by traders are the 12-day and 26-day EMAs. You should remember to modify the EMA set-up when you trade new instruments because there isn’t a one-size-fits-all structure when it comes to an EMA indicator.
Exponential moving average example
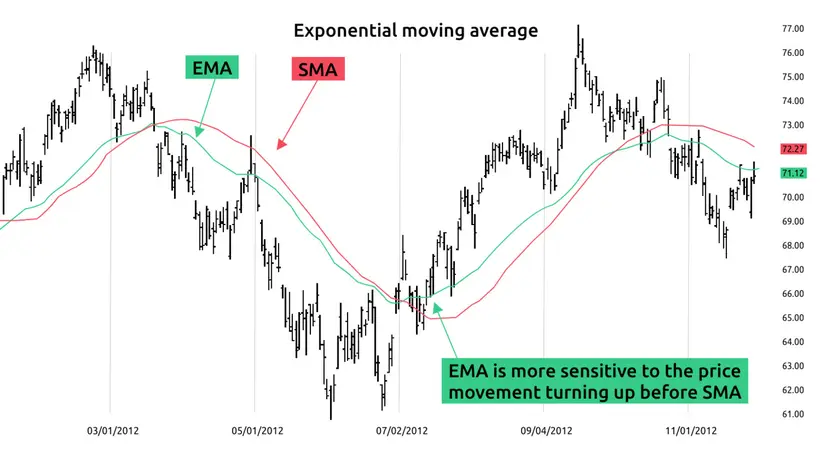
EMA reduces the effect of the noise by cutting the time lag of the data. This is because EMA may exclude past prices, which no longer have an impact. By assigning a greater weight to newer prices, the EMA line sits closer to the price action than does the simple moving average (SMA). Let’s look at the graph, with blue lines representing the EMA and red lines showing the SMA.

Note, there are three points signalling changes in direction. On the left and the right we see a downward trend, while in the middle of the graph the price movement is upward. It is clear that the EMA signals directional changes earlier than the SMA in all three cases. This is because the EMA line adapts faster to price changes than the SMA line, and therefore it signals earlier.
How to use the exponential moving average
EMA is often the preferred moving average indicator for day traders who tend to execute their trades swiftly. To make an exponential moving average formula, you can use the EMA as a standalone indicator for your trading strategy, but make sure you have defined a system with which to confirm the signals identified. You can also set up two EMAs with different time frames, or combine the indicators with other technical analysis indicators.
You can use the EMA in your trading strategies in the same way you use other moving averages. Accordingly, you should identify the trend direction or look for a buy or sell signal using two exponential moving averages with different time frames.
A buy- or golden-cross signal occurs when a shorter-term EMA moves above a longer-term EMA, known as a golden-cross signal. A sell signal (known as a death cross) can be identified when a short-term EMA line moves below a longer-term EMA line. Since EMA is one of the moving average indicators, it can also provide the opportunity to determine potential support and resistance levels.
Before defining and plotting an exponential moving average for the selected instrument, you should know how to read EMA. The application of EMA when executing trades follows the general rules for moving average indicators, which can be summarised as:
- EMA with a longer time frame helps you identify the general trend of a security or the market. If the price crosses a long-term EMA, such as the 200-day line, this indicates a possible reversal.
- Plotting one EMA with a short time frame and another with longer time frame helps to identify crossovers.
- A golden cross signals a potential buying opportunity.
- A death cross signals a potential selling opportunity.
- Identify support levels – when the price intersects with EMA line from above, the line serves as a support.
- Identify resistance levels – if the price touches the line from below, it will show that EMA serves as potential resistance level.
You can develop an exponential moving average trading strategy by combining multiple EMAs with different time frames. In addition you can identify trends and confirm identified signals by using other types of indicator such as the relative price index, standard deviation or volume rate of change to analyse an asset’s price in terms of its momentum, volume levels or price volatility.
Of course, this doesn’t mean that you should employ every possible type of indicator, thinking this will increase accuracy. It would instead mean a very complex trading strategy.
You should test different combinations of indicators and see which works best for you. Remember to keep your strategy simple, so you aren’t buried under too many signals from a high number of indicators. Avoid the inclusion of multiple indicators providing the same signals and you will avoid the potential redundancy.
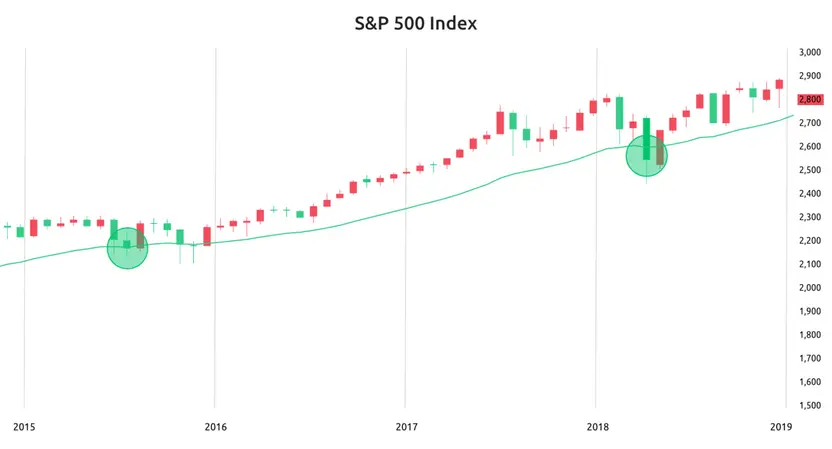
Look at the graph below to see how a 200-day EMA might help you to identify potential increases in price.

At the indicated points, you can see that during an upward trend, when the price touches the line, EMA signals a support level and the price moves up again. This signal indicates potential buy points. Consequently, sell signals using the 200-day EMA will be identified when the price touches the line from below, indicating that EMA serves as resistance.
Advantages of exponential moving average
- Eliminates the drawbacks of placing equal weights on all price changes
- Includes latest prices change much more quickly than simple moving average indicators
- EMA can be preferable to simple moving average in volatile markets because it adapts swiftly to price changes
Disadvantages of exponential moving average
- EMA is susceptible to whipsaw (or incorrect signals) because of its ability to quickly adapt to price changes
EMA alone cannot determine optimal entry and exit points as it is a lagging indicator; instead, it provides postponed points. Nevertheless, it is a valuable EMA indicator when you want to determine the direction of the trend.
FAQs
Exponential moving average (EMA) gives greater weight to the most recent price data in its calculations than those performed by a simple moving average. This means that the EMA indicator can react much faster to changes in the price of an asset. EMA can be preferable to simple moving average in volatile markets because it adapts swiftly to price changes.
When it comes to an exponential moving average strategy, the most common periods used by traders in setting an EMA time frame are 50-, 100- and 200-day periods for the long-term line. The typical short-term time frames used by traders are the 12-day and 26-day EMAs. You should remember to modify the EMA set-up when you trade new instruments because there isn’t a one-size-fits-all structure when it comes to an EMA indicator.
EMA is often the preferred moving average indicator for day traders who tend to execute their trades swiftly. The typical short-term time frames used by day traders are the 12-day and 26-day EMAs. You can also set up two EMAs with different time frames, or combine the indicators with other technical analysis indicators.


