Let’s compare the Awesome Oscillator vs MACD momentum indicators and figure out how to combine them to make a profit

Contents
- Awesome Oscillator vs MACD: what is the difference?
- Awesome Oscillator trading strategy
- MACD trading strategy
- Awesome Oscillator and MACD trading strategy
Awesome Oscillator vs MACD: what is the difference?
Awesome Oscillator (AO) and MACD are both technical analysis indicators that measure the market momentum. They are used to provide signals for potential trend direction, trend reversal or entry and exit alerts by analysing the weakness or the strength of an asset. Even though there are similarities in the way the Awesome Oscillator and MACD strategy functions, there are also some differences in the calculation, the way they appear on the chart and some of the basic strategies.
- Awesome Oscillator calculations are based on the median price while the MACD is calculated using the closing price.
- AO uses the 34-period and 5-period simple moving average. The MACD indicator uses 26-period and 12-period exponential moving averages along with the 9-period signal line.
- Using the exponential moving averages would mean that MACD can react quicker compared to the Awesome Oscillator.
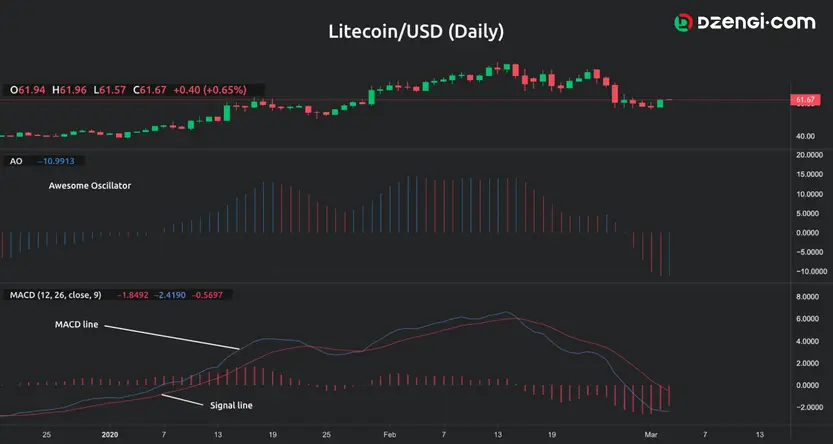
When you plot the indicators on your chart, they will appear in a separate box below the price chart. But there are certain differences in the way they appear. The following graph contains the MACD and AO indicators.

The Awesome Oscillator looks like a histogram with red and green (or red and blue) bars. Aside from the histogram, the MACD will additionally display two lines called the MACD line and the signal line. It should be noted that both indicators are unbounded oscillators. Both fluctuate around a zero-line, which is used as the bases for certain trading strategies.
Awesome Oscillator trading strategy
Traders can use different types of AO trading strategy to identify potentially profitable opportunities. The basic strategies which can be implemented in your trading activities, based on the AO indicator, are the zero-line crossovers, twin peaks and the saucer.
The zero-line crossover buy signal appears when the AO crosses above the zero line. Before entering a long position, traders would also look at the colour of the bars: they would expect a certain number of green bars to appear before the crossover takes place and also after the crossover. Sell signals are identified when the AO crosses below the zero-line and traders would want to see red bars before and after the crossover before opening their position. The problem with this strategy is that it can provide multiple false signals.
Another Awesome Oscillator strategy is the twin peaks strategy when traders try to identify two consecutive peaks for a bearish signal, with the second peak being lower, or two successive peaks for a bullish alert when the second peak is higher. Also, here, traders would consider the colour of the histogram after the second peak, prior to opening the position.
The third basic strategy is called saucer strategy when traders try to locate a specific set-up (pattern) on the histogram. Accordingly, for a long position, they want to see three consecutive bars above the zero-line which will be two red bars (the second one is shorter than the first) followed by a green bar. For a short position, traders would expect to see two green bars, the second being smaller, and the third bar is red.
There are other trading systems, which can be used by traders based on the AO indicator. Pay attention to the Awesome Oscillator trading strategy description which considers the combination of multiple indicators or a combination of AO with the price action.
MACD trading strategy
The MACD indicator also has its basic trading strategies which are used by traders to determine potential signals. The simplest MACD trading strategy is based on MACD crossover signals. Here, traders analyse the interaction between the MACD lines, and you should keep in mind that the MACD line is faster than the signal line.
- Bullish signals are detected when the MACD line crosses above the signal line.
- Bearish signal occurs when the MACD line crosses below the signal line.
MACD divergences is a MACD trading strategy used by traders because it can provide information that the trend might be coming to an end and reversal could be expected. The divergences are identified when the MACD line does not move in the same manner as the price.
- A bullish divergence can be identified when the price is forming lower lows while the MACD forms higher lows.
- A bearish divergence is detected when the price has higher highs while the MACD exhibits lower highs.
Going through the MACD trading strategy description would also mean that you consider how apart or close to each other the two lines are on the MACD graph.
- A stronger trend may be identified when the two lines are moving away from each other.
- A weaker trend is detected when the two lines converge.
Awesome Oscillator and MACD trading strategy
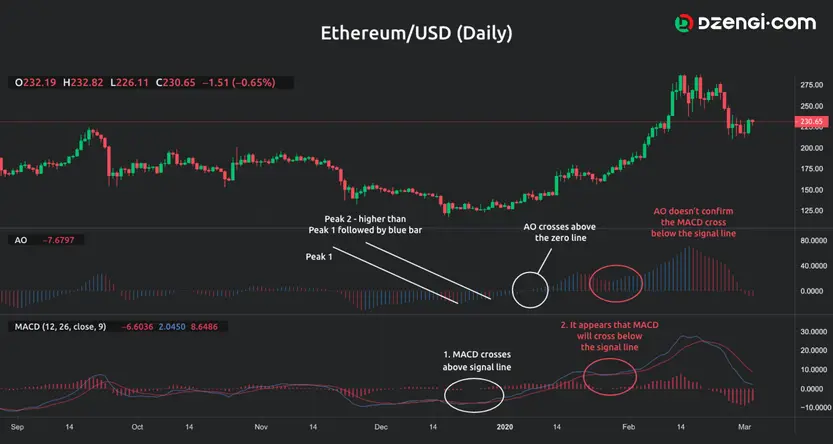
You can make trades through a combination of specific Awesome Oscillator strategy and MACD strategy by trying to detect entry and exit signals using the MACD indicator and confirm the signals with the AO indicator. For instance, you can set up a trading system composed of the AO twin peaks strategy and the MACD signal line crossover. Let’s look at the following graph to grasp the idea behind the AO and MACD trading signals.

The graph shows how traders can confirm the identified MACD signals using the Awesome Oscillator indicator. In addition, it shows a set-up of a MACD signal which is not confirmed and how it could be determined.
The white circle displays the point at which the MACD line crosses above the signal line, which is an indication of potential bullish movement. The bullish movement is confirmed when the AO indicator exhibits a fully formed bullish twin peaks alert by forming two peaks with the second one being higher, followed by a blue bar.
The price moves in a strong upward trend after the signal has been identified and confirmed with the AO indicator after a couple of periods. You may notice that the trader who entered a long position after the signal is confirmed with the AO crossover would have a highly profitable position because the price has increased from $138 to nearly $280.
Another signal that should be analysed is the one marked with a red circle on the MACD indicator when it seems that the MACD line will cross below the signal line, which is an alert for potential bearish movement. However, you can see that the AO does not confirm the bearish move with neither of its signals as the histogram does not cross the zero-line, it does not fulfil the twin peaks alert and also the saucer bar set-up does not exist. Consequently, the trader can decide to maintain their long position until the relevant signal is identified.
When it comes to MACD vs Awesome Oscillator, try to find the adequate trading system in accordance to which asset you plan to trade by identifying which system provides you with the most accurate signals. Also, traders need to detect the potential patterns when it comes to price behaviour, as well as the best indicators set-ups for different instruments.


