With the Covid-19 pandemic, America’s nonfarm payroll report is increasingly important

This report is an important barometer for the US economy. Right now, it’s providing a powerful insight into the impact that the coronavirus pandemic and mass-vaccination programme are having on America’s workforce.
What does NFP stand for? That’ll be nonfarm payroll. This report is published monthly by the US Bureau for Labor Statistics. It offers an in-depth look at how employment figures are looking nationwide.
Here, we’ll go through the latest NFP news, explain how a trading strategy influenced by this report can help you navigate the markets during these uncertain times, and look at the types of statistics you’ll be able to find in the report.
What is the nonfarm payroll report?
The NFP report aims to offer a snapshot of the US workforce. It runs to dozens of pages and contains a wealth of data that breaks employment rates down by sector, gender, race, age, location, length of service, earnings and hours worked a week. The NFP report allows economists and traders to spot underlying trends in the market – key themes such as which industries are contracting and expanding, and how things have developed since last month or last year.
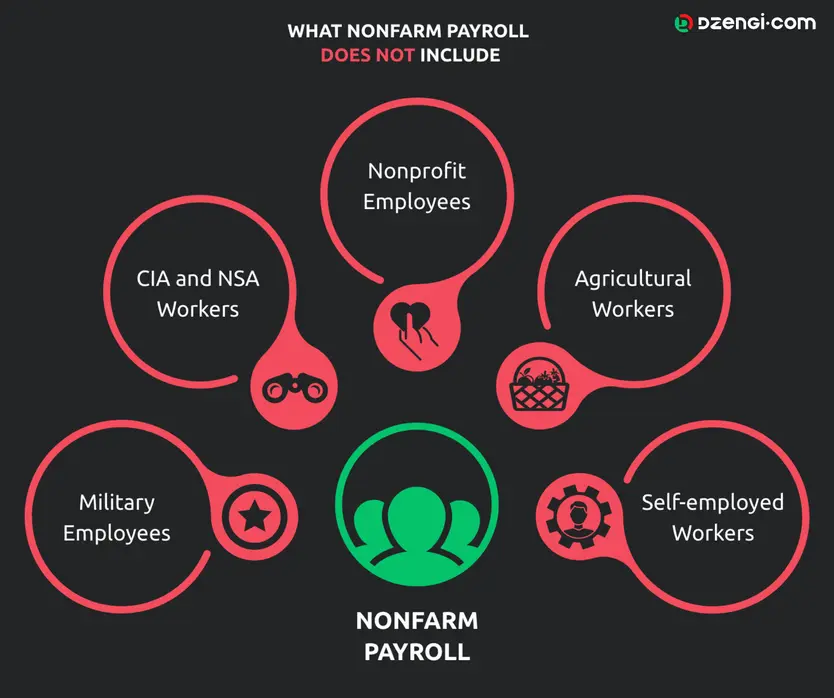
As the name suggests, NFP data doesn’t cover everything. Agricultural workers are not accounted for in these monthly reports, nor are people who work for not-for-profit organisations, such as charities. Although the vast majority of government employees do fall under the nonfarm payroll figures, those working for the Army, the National Security Agency and the Central Intelligence Agency do not appear. In some ways, you could argue that this adds up – this data could be sensitive.
Another big caveat to remember when it comes to the report is that it won’t exhaustively cover roughly 16 million Americans who are self-employed. Only those who have formally registered their business are included in the stats.
Nonetheless, it’s a pretty comprehensive report. Estimates suggest that it covers about 80% of the US population.
So, when is the report released? Well, the US Bureau of Labor Statistics has created a fixed timetable with a view to delivering some certainty for investors. The data is usually published on the first Friday of every month.
To ensure that it doesn’t spook the New York Stock Exchange or the Nasdaq while trading hours are underway, nonfarm payroll statistics are issued at 8.30am EST, roughly half an hour before the opening bell. This is in keeping with the reporting practices of listed companies, who will normally issue their earnings reports once markets close for the day.
The benefit of this approach is that we know exactly when reports are published. Every release covers the preceding month. As such, we’ll get May’s figures on June 5, June’s figures on July 2, July’s figures on August 7, and so on.
Nonfarm payroll dates
While we’re here, let’s take a peek of the headline figure from the NFP report over recent months.
A loss of 306,000 nonfarm payrolls in December 2020, normally a busy time, was not as severe as the 710,000 from March 2020, which was the largest since the 2008 financial crisis.
The first three months of 2021 showed the economy regaining steam at the same time as mass-vaccination programs were ramping up. Another dip in April 2021 was followed by an even more impressive recovery to almost 1.1 million nonfarm payrolls in July 2021.
In September 2021, nonfarm payroll rose by 194,000, with unemployment falling 0.4% to 4.8%. There were gains in leisure and hospitality, professional and business services, retail trade, and in transportation and warehousing.
Nonfarm payroll impact on forex, stocks and commodities
The impact of NFP reports can be compared to the butterfly effect – the analogy where a butterfly flapping its wings in one place can cause a typhoon on the other side of the globe. The point is that these figures can have large and surprising consequences.
You wouldn’t necessarily think that this data would impact foreign exchange markets all that much, but can do. Strong growth in employment means that investors from around the world are increasingly likely to throw their cash behind US ventures, in turn strengthening the dollar. On the flipside, weakening economic growth – or performance that simply doesn’t meet the expectations of analysts – has the potential to cause sell-offs as investors seek to store their capital elsewhere.
Over on the stock markets, you may notice that the nonfarm payroll report has an outsized effect on individual companies. For example, a net loss in employment figures could have a hit on businesses that provide consumer discretionary items – products that are non-essential but desirable. If large swathes of the population are being let off, it’s highly likely that they’ll have less disposable income to spend on such luxuries.
That brings us neatly to commodities. NFP trading patterns typically show that the likes of gold perform strongly whenever figures from the payroll report are worse than expected. This is because precious metals are often seen as a safe haven during times of turbulence.
NFP trading: top tips
Are you on the lookout for a nonfarm payroll forex trading strategy? If so, here are a few hard-and-fast rules about what’s good and bad for the US dollar.
Dire figures normally prompt forex traders to opt for currencies with a higher yield than the US dollar – not least because it illustrates that the economy isn’t growing or is in decline. What’s unusual about the 2020 situation was that practically every country was in the same boat.
As forex markets don’t close, it can be tempting to make moves as soon as figures come out. However, this can work against you. Once the overall tone and sentiment of the report have been established, you’ll normally find that trading pairs such as USD/EUR follow an upwards or a downwards trajectory, and it can be easier to capitalise on this momentum. Of course, there’s no guarantee that any strategy will work.
NFP trading: reading the data
When NFP trading, taking the time to digest the data and avoiding knee-jerk reactions can ultimately prove more profitable in the long run.
Remember that the numbers can be revised, and it can be a good idea to look at how trends are evolving over a period of several months. Keep an eye on how unemployment and average wages are developing in the medium term, as this will offer a precious insight into whether the US economy is gaining strength or starting to decline.
Separate to the nonfarm payroll report, weekly unemployment claims issued by the US Department of Labor can provide a helpful indicator of what’s to come. Unemployment claims ballooned in late March to May 2020. There were more than 22 million jobless in the first four weeks of the pandemic.
It’s unlikely that the nonfarm payroll report will weigh heavily on the markets for days on end, and this means that capitalising on the statistics often falls to those who are making short-term trades. Technical analysis is your friend here – and it’s worth remembering that erratic market moves can work in your favour.
This report is published monthly by the US Bureau for Labor Statistics, and it offers an in-depth look at how employment figures are looking nationwide. The NFP report allows economists and traders to spot underlying trends in the market.
Agricultural workers, people who work for not-for-profit organisations, and those working for the Army, the National Security Agency and the Central Intelligence Agency do not appear. Estimates suggest that it covers about 80 per cent of the US population.
Strong growth in employment means that investors from around the world are increasingly likely to throw their cash behind US ventures, in turn strengthening the dollar. On the flipside, weakening economic growth – or performance that simply doesn’t meet the expectations of analysts – has the potential to cause sell-offs as investors seek to store their capital elsewhere.