OBV is a leading indicator for predicting price movements based on volume levels of assets

Contents
- OBV indicator calculation
- What is on-balance volume?
- How to read the on-balance volume indicator
- How to use the on-balance volume indicator
- Advantages of on-balance volume trading indicator
- Limitations of OBV trading indicator
The on-balance volume (OBV) indicator is a leading technical analysis indicator. It was introduced in 1963 by Joe Granville in the book Granville’s New Key to Stock Market Profits.
The OBV indicator is based on the concept that volume plays an important role in price movements and that it can be used to anticipate potential price changes:
- When the volume of a security or an asset decreases without a simultaneous decrease in price, you can expect the price to go down.
- When the volume increases without the accompanying increase in price, an upward price movement is anticipated.
OBV indicator calculation
On-balance volume is what’s known as a cumulative indicator – when a price increases, it adds volume, and during downward price movements, it subtracts volume. Accordingly, OBV is calculated as follows:
- When today's price is higher than yesterday’s price
OBV = OBV (yesterday) + Volume today
- When both prices are equal (yesterday’s closing price and today’s closing price)
OBV = OBV (yesterday)
- When today’s closing price is less compared to yesterday’s price
OBV = OBV (yesterday) – Volume today
What is on-balance volume?
The indicator can be positive or negative, accordingly oscillating around the zero-value line and between positive and negative values. Don’t get confused if you can’t see the zero line on your chart. The OBV values may be high or low and move further from the line, but at some point, they can cross above or below the zero line.
On-balance volume has a positive value when the price today is higher than the previous closing price, while a negative value appears if today’s price is lower than the last closing price.
How to read the on-balance volume indicator
The OBV indicator looks like a line plotted in a box at the bottom of your chart. Here is an example:
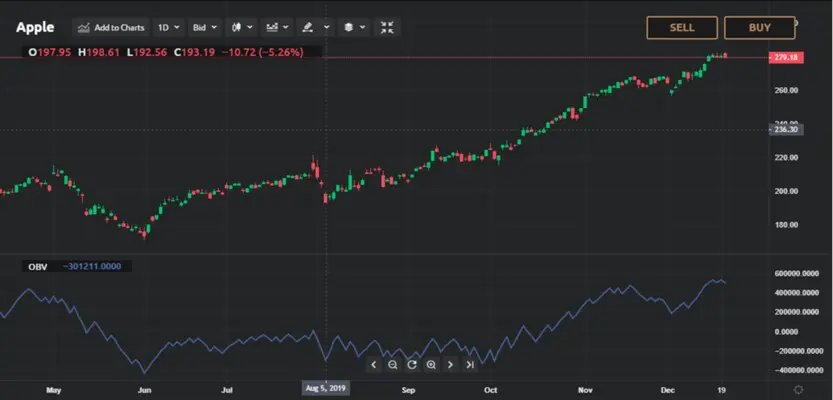
The blue line is the on-balance volume line and you can see how this indicator takes positive and negative values.
It is a cumulative indicator, so if the last closing price is higher than the previous closing price, the day’s volume is called up-volume. If the closing asset price is below the previous day’s closing price, the volume is down-volume.
You can see a specific value for the OBV indicator but your primary focus should be on its direction. It can tell you whether there is buyer pressure or seller pressure in the market. The on-balance volume indicator potentially shows whether the market participants entering long positions are accumulating the underlying asset or whether the asset is being sold.
How to use the on-balance volume indicator
Traders use the indicator for an on-balance volume trading strategy to predict price movements or when they want to confirm price trends. The calculation is based on divergences between the price and volume.
Bullish divergence – when the price action decreases and OBV increases simultaneously, you can anticipate upward movements. Accordingly, for a bullish divergence, the price displays lower lows while the indicator shows higher lows.
Bearish divergence – identified when the price continues to rise while at the same time the OBV indicator declines. When the price exhibits higher highs and on-balance volume has lower highs, it’s a sign of a bearish divergence.
Confirming the trend – to confirm the trend direction, see whether the OBV line moves in the same direction as the price. If on-balance volume increases when price increases, you can confirm an upward trend and the volume moves to support the price growth.
Potential breakout or breakdown from the ranging market – during ranging market conditions, you should be on the lookout for a rising or decreasing on-balance volume indicator value, as it can a signal a potential breakout or breakdown in price. An increasing OBV line can alert you to a potential upward breakout because accumulation is in place.
A decreasing on-balance volume line may identify potential price breakdowns because of the distribution. Examples of how OBV confirmation works and how a divergence would look are presented in the graphs below.
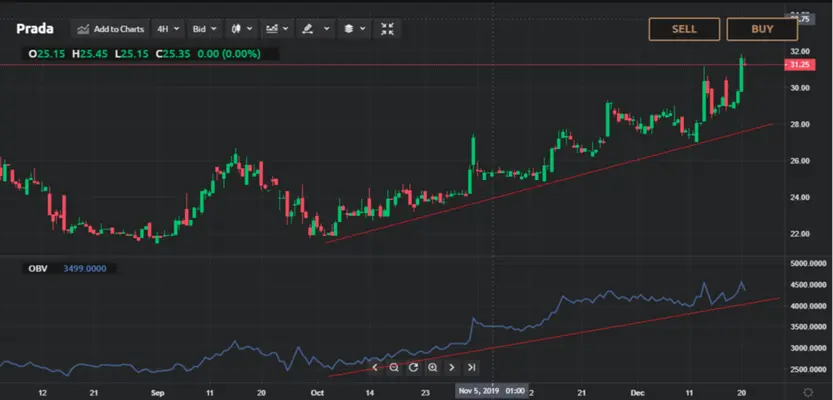
You can see that the price is moving upwards, forming higher highs, which is a visible indication of an upward trend. Traders confirm this trend direction by looking at the OBV indicator direction. It is apparent that the indicator line is increasing and moves in the same direction as the price action.
The following graph shows how a potential divergence alert would look when you use the on-balance volume trading indicator.
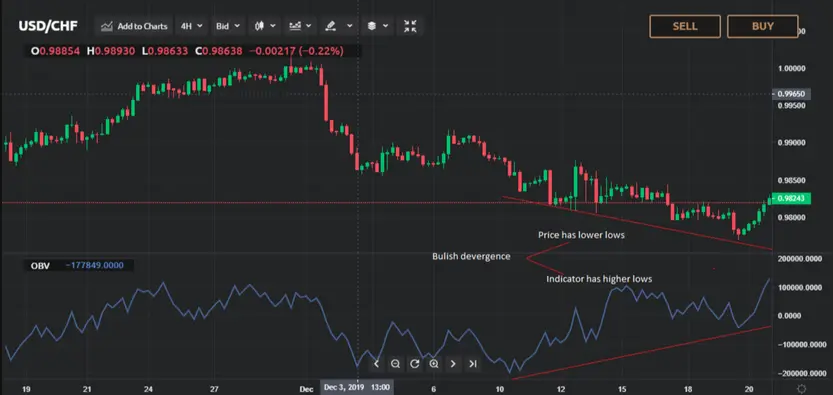
Divergence alerts can occur when the price action and the indicator don’t move in the same direction. Consequently, a bullish divergence signal can be seen on the graph – the price has lower lows while the OBV indicator displays higher lows.
Traders usually confirm their on-balance volume trading signals with additional indicators. You can combine it with moving averages, Ichimoku Cloud, Bollinger Bands and so on. In the end, the decision regarding the right combination of indicators for your multi-indicator trading strategy and your on-balance volume formula depends on your personal preferences.
Advantages of on-balance volume trading indicator
- Easy-to-understand calculation.
- As a leading indicator, OBV can provide signals for a potential breakout or breakdown when the price moves sideways.
- As a cumulative indicator, OBV can be used to confirm the trend direction.
- It gives traders a method to detect divergences.
Limitations of OBV trading indicator
-
A large spike during a trading day can cause OBV to spike, even though the significant increase is not created because of a rise in volume. There are numerous reasons, such as company announcements, that can lead to significant price increases.
-
The same volume is added or subtracted regardless of whether the price moves a couple of cents or a couple of dollars. Hence, OBV doesn't account for the degree of price movement.
-
OBV doesn't incorporate all the relevant data needed for price action analysis.
-
On-balance volume can provide misleading trading alerts if you plot it on a smaller time frame. The reason is that at shorter time frames, the price has noise due to the higher price volatility. You should avoid trading solely on OBV on shorter time frames, and try to combine it with other indicators.
