Directional Movement Indicator determines the price direction and the strength of a trend.

What is the Directional Movement Index?
The Directional Movement Index, also known as Directional Movement Indicator (DMI) was developed in 1978 by J Welles Wilder, who also created trading indicators such as the Average True Range Indicator and the Relative Strength Index. The DMI is used to evaluate an asset’s price direction and price action strength. This technical indicator is especially useful for trend trading strategies because it enables traders to identify trends with strong momentum.
DMI may be applied across different time frames and used to assess the price movements of different types of assets. Essential components of this indicator are the negative indicator (-DI) and the positive indicator (+DI), which are plotted on the DMI graph. They are calculated together with the Average Directional Index or ADX. The respective values are estimated with the associated price highs and lows and respective previous closing prices.
The DMI index is usually located under the price chart as a graph composed of three different lines. A Directional Movement Indicator setup is presented in the following chart.
The components used in the Directional Movement Index graph are:
-
Positive directional indicator (+DI). This is associated with an upward trend. It is based on the difference between today's price and yesterday's price, and the obtained values from the selected periods are summed.
-
Negative directional indicator (-DI). This is associated with a downward trend. It is estimated on the price difference between low prices from today and yesterday. The results for the selected periods are added and the -DI line is formed.
-
DI period. This refers to the number of periods used in the calculations for this indicator. While the default number of periods depends on the trading platform, the common setting is 14 periods. However, traders may change the number of periods based on the analysed time frames or their trading strategies.
Although the Directional Movement Index may sometimes be plotted by itself, composed of only two lines for +DI and - DI, it is frequently displayed with the ADX line, which NOTE: deletion is a repeat from above and not needed gives an insight into the strength of a potential trend.
Each component serves a specific purpose, and trading signals are detected based on the movement of each line and the potential crossovers between the lines. The distance between the lines is considered when evaluating the potential strength of a price movement.
How to use Directional Movement Index?
Even though the Directional Movement Index formula and the calculations behind the indicator may be perceived as slightly complicated, identifying signals using the DMI is easy to apprehend. To understand how to read the Directional Movement Index, traders should pay attention to the way in which each line moves and the manner in which they intervene with each other.
One way to use the Directional Movement Index to determine the strength of an existing trend is through the associated ADX values. A potentially strong trend may be identified when the ADX value is above 25. And a weak trend occurs if the ADX value is below 20. Traders may adapt the base values associated with a strong or weak trend and they can set their reference value to detect a strong trend at 30, 40 or higher.
Traders should also look at the movement of the +DI and -DI along with the ADX line when trying to identify whether to take a long or a short position. This is in a sense that while ADX gives an overview of the trend strength, positive DI and negative DI assess the direction of the price action. An opportunity for a long position may be detected when the +DI crosses the -DI line from below and the bar where the crossover above -DI is recorded is labelled as a signal bar. In this situation, traders will also look at the ADX line to evaluate the existence of a trend and its strength.
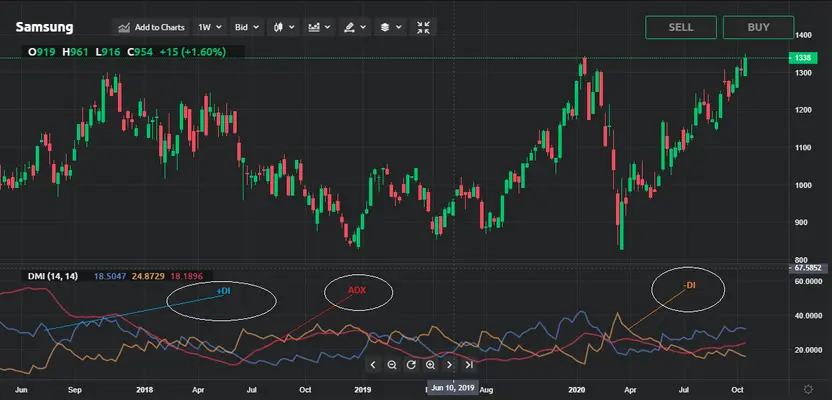
An opportunity for taking a short position arises in a situation when the -DI crosses the +DI from below. The bar where the crossover is detected represents the signal bar. Traders should also look at the ADX value to assess the strength of the relevant trend. An example of potential crossovers between +DI and -DI are provided in the chart below.

The white circles show the points where the two DI lines cross over, signalling the associated price direction. The circle marked on the left side of the chart (line 1) +DI crosses the -DI from below to above, which signals that the price will increase. The price bars show that the price moves in an upward trend for the following period. It is also evident that the trend is stronger as the two lines move apart.
The second circle near the middle of the graph shows the point where -DI crosses the +DI from below, signalling a potential decrease in price, which is manifested on the price chart. The power of the DMI indicator is that traders can use it to identify potential buy signals and probably identify when to close the position and open a short position, consequently profiting in both directions even with the same underlying asset.
The trading signals using the Directional Movement Index can be summarised as follows:

Of course, there could be other setups depending on the trading strategies, but traders commonly try to assess the positions of each line in the DMI indicator. With the implementation of a Directional Movement Index strategy, traders try to evaluate the momentum and the price direction.
Although Directional Movement Index is a trend trading indicator, traders may also use it for identifying sideways price movements and accommodate the signals in their range trading strategy. It is generally anticipated that a range-bound movement is displayed when the ADX value is below 20.
Even though DI crossovers may appear as an easy way to identify trading signals, traders should confirm these signals with other trading indicators because false signals might occur. Some of the basic limitations of the Directional Movement Index are related to the way it reacts to short-term price changes or when volatility is high. DMI may give wrong signals in periods of low volatility since it has decreased sensitivity to short-term price fluctuations. Alternatively, the signals may lag during high volatility.

FURTHER READING: How to read and use the Awesome Oscillator trading indicator
FURTHER READING: How to read and use the Chaikin Money Flow trading indicator