The Chaikin Money Flow indicator measures the type of pressure that dominates the market

Contents
- What is Chaikin Money Flow?
- How to read the Chaikin Money Flow
- Chaikin Money Flow trading
- How to use the Chaikin Money Flow
- Advantages of Chaikin Money Flow indicator
- Drawbacks of Chaikin Money Flow indicator
What is Chaikin Money Flow?
Marc Chaikin introduced the Chaikin Money Flow indicator (CMF) in the 1980s as a technical indicator that measures the money flow volume during a specific period. The CMF indicator can be used to determine whether there is buying pressure or selling pressure on the market. The indicator is based on the idea that when the closing price is close to the high, an accumulation is evident, whereas if the closing price is closer to the low, a distribution occurs. The CMF is commonly used to confirm a trend, measure a trend strength or identify potential trend reversals or breakouts.
The indicator default setting is either 20 or 21 periods and the Chaikin Money Flow calculation is performed in three steps:
- Calculate the money flow multiplier
Money flow multiplier = [(Close price - Low price) - (High price - Close price)] / (High - Low)
- Find the money flow volume by multiplying the money flow multiplier for each period by the associated volume
Money flow volume = Money flow multiplier x Volume for the period
- Add up the money flow volume for the number of periods considered (the default set-up is 20) and divide the value by the 20-period sum of the volume
20-Period CMF = 20-Period sum of money flow volume / 20-Period sum of volume
As you can see, the money flow volume depends on the value of the multiplier, and the multiplier has a positive value when the close price is above the high-low midpoint for the period and negative when it is below the midpoint.
How to read the Chaikin Money Flow
As an oscillator indicator, the Chaikin Money Flow indicator is available on most trading platforms and is located below the asset chart as a line that fluctuates around the zero line. The default set-up is for 20 periods, but you have the option to change that according to your preferences and strategy. The CMF can take values between +1 and –1, but it should be noted that it does not reach the extreme value often. The area above the centre line or zero line is considered to be a bullish territory, while the area below the line is considered to be a bearish territory. Consequently, when the CMF values are above the zero line, it is an indication of the existence of buying pressure, while selling pressure probably exists when the indicator values are in the negative area.
When plotted on your trading platform, the CMF indicator looks as shown in the following graph.
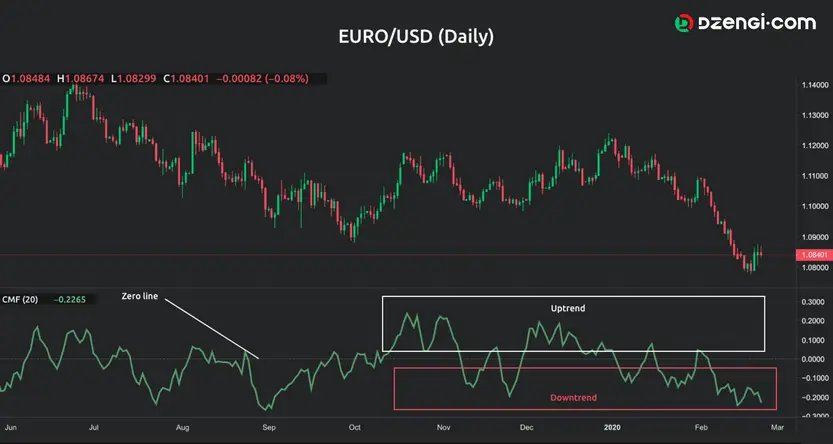
You can see that when the CMF line is in the zone marked with the white rectangle, it is considered to show an upward trend, while a CMF line in the red rectangle indicates a downtrend. Usually, the values of the CMF are within the +0.5 to -0.5 interval and it rarely reaches the levels of +1 or -1. Accordingly, it can be stated that:
- When CMF is approaching +1, the buying pressure becomes higher.
- When CMF is nearing -1, the selling pressure is higher.
Chaikin Money Flow trading
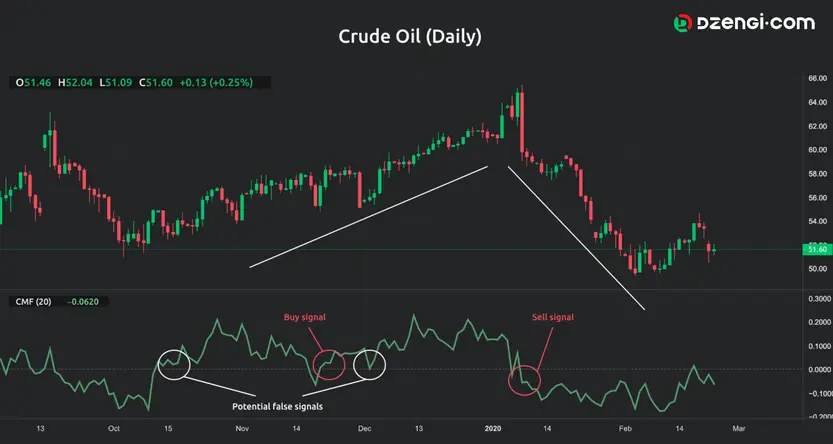
Chaikin Money Flow crosses are one way in which traders use the indicator to identify potential alerts. They show potential signals by looking for crosses between the CMF line and the centre line. The basic way to determine a buy signal is when the CMF line crosses above the zero line while the price continues to move upwards. Conversely, a sell signal is identified when the Chaikin Money Flow indicator crosses below the zero line with the price moving in a downward direction.
The downside with the cross signals is that they may be false, because the CMF line can briefly cross the zero line, then cross back again. Hence, some traders mark the +0.05 and -0.05 levels by plotting lines, and enter long positions when the CMF is above the +0.05 level or execute short positions when the CMF is below -0.05.
An example of what CMF cross signals look like is presented in the next graph.
Going through the graph, you’ll notice that the CMF crosses above the zero line at the point marked with the red circle on the left, indicating a potential buy signal. After taking a long position, the price continues to move in an upward direction. The sell crossover is marked with the right-hand red circle, when the trader may decide to take a short position, and it can be seen that the price continues to fall. The points in the white circles serve the purpose of helping you understand why some traders plot the +0.05 and -0.05 levels – as you can see, at first glance, it looks as though there is a cross over the zero line, but this crossing (if any) is only temporary as the values move back to the bullish zones.
How to use the Chaikin Money Flow
Chaikin Money Flow can be used along with support and resistance, when it can confirm breakouts from these levels. Consequently, if the price breaks at the resistance level during an upward trend while the CMF exhibits higher highs, it would indicate that the trend will continue its upward direction. On the other hand, in a downward trend, when the price breaks below the support level while the CMF reaches new lows, it confirms that the downward trend will continue.
A potential trend reversal can be identified through possible divergences when the price action and the CMF move in opposite directions. Bullish divergence may appear when the price moves to a new low while the CMF does not follow the same movement and this is an indication that an upward trend may emerge. On the other hand, a bearish divergence is formed when the price moves to a new high while the CMF remains the same or even falls, indicating the possible beginning of a downward trend.
Although volume traders commonly use CMF, it is not particularly reliable as a standalone indicator. Therefore, you should use the indicator in conjunction with other technical analysis indicators to confirm the identified signals and create your Chaikin Money Flow strategy.
Advantages of Chaikin Money Flow indicator
- A Chaikin Money Flow formula is a useful indicator during trending markets.
- It is a useful tool for confirming trend direction.
- The CMF can provide possible exit signals when there is potential for a trend reversal.
Drawbacks of Chaikin Money Flow indicator
- It should not be used as a standalone indicator.
- Traders cannot determine potential stop-loss and take-profit points.
- CMF can provide false signals during range-bound market conditions, as the values can fluctuate around the zero line.
- It would be better not to use it on smaller time frames.
