The accumulation/distribution line shows whether there is a buyer's or seller's pressure on the market and helps you predict price movements

What is the accumulation/distribution line?
Accumulation Distribution indicator or accumulation/distribution line (ADL), also called A/D, AD or Accum/Dist, is a leading volume type of technical indicators created by the trader Marc Chaikin in the 1980s. It helps predict future price changes using the relation between the asset's price and volume. The indicator measures the cumulative money flow. As the name implies, traders try to analyse whether there is accumulation or distribution for a given asset.
The accumulation distribution formula considers the total money flow volume for certain periods. The calculation is done in three primary steps:
- Step 1: Calculation of the money flow multiplier (positive multiplier will result in increased accumulation distribution line and a negative multiplier will create a falling line):
Money flow multiplier = [(close - low) - (high - close)] (high- low)
- Step 2: Multiply the money flow multiplier by the volume in order to obtain the money flow volume:
Money Flow Volume = Money Flow Multiplier x volume for the period.
- Step 3: AD indicator line is represented as the total of the previous accumulation distribution and the Money Flow Volume for each period:
The current A/D value (line) = previous A/D value (line) + current value for Money Flow Volume
Of course, you don’t need to calculate it yourself – just plot the indicator on your chart on a trading platform. However, when you know how the indicator values are calculated it allows you to understand the accumulation distribution indicator better and easily.
How to read an accumulation distribution chart
The accumulation distribution indicator is a line plotted in a box under the price bars. It can take positive or negative values while it fluctuates around a zero line. The accumulation distribution line shows whether there is a buy pressure (accumulation) or a seller side pressure (distribution). Accordingly, you can predict price movements based on the supply and demand for the asset.
If the last closing price is higher than the previous day closing price it means there is volume accumulation. In contrast, distribution occurs when the current closing price is lower than the previous day closing price.
Increasing ADL alerts an accumulation, and decreasing ADL signals that the seller's pressure is dominating the market. An example of accumulation or seller pressure is shown in the next graph.
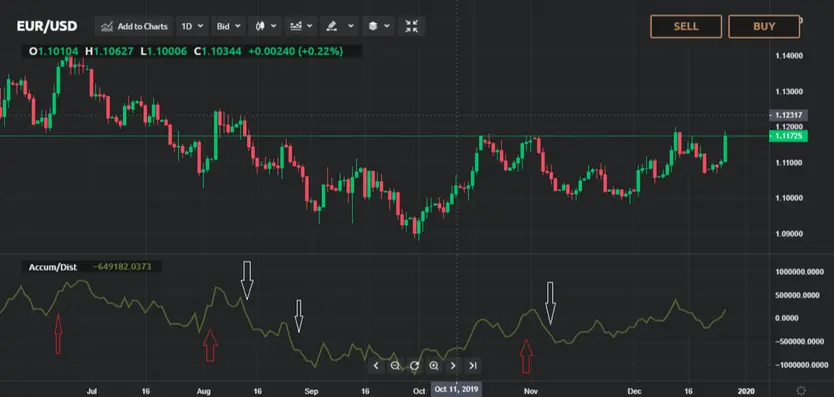
You can see that the red arrows point toward a rising ADL indicating buyer pressure. The white arrows point toward periods when the distribution is stronger, which detects sellers' pressure.
How to use an accumulation distribution indicator
The accumulation distribution indicator trading strategy can be used to identify potential price and volume divergences or to confirm a trend. It also allows detecting alerts for potential reversals.
Determining trend direction
Apply accumulation/distribution indicator when you want to confirm the trend direction. When you see that the price and the indicator form higher lows and higher highs then it means an upward trend. The negative or downward trend can be expected when the price and the accumulation/distribution indicator form lower lows and lower highs. The next graph shows the way in which ADL can be used to confirm a trend.
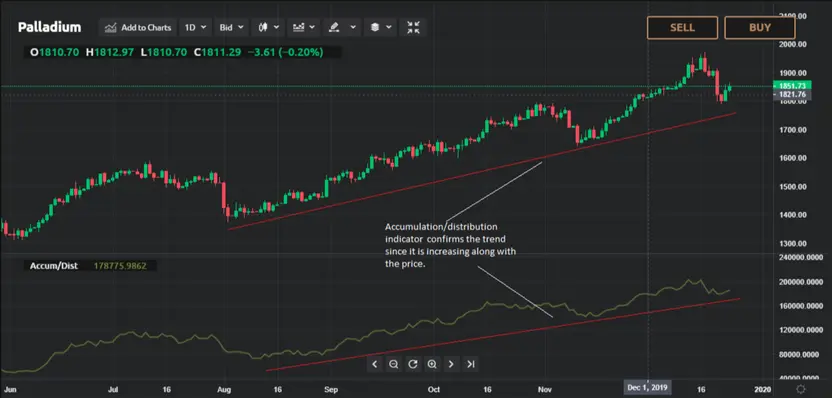
You can see that the accumulation distribution line indicator increases along with the rise in price action. It means that the ADL is confirming the trend.
Anticipate potential reversals and breakouts
When the price is trading in a range, an increasing accumulation/distribution indicator may show accumulation. In such a case, it will signal a potential upward breakout while a decreasing indicator value points to potential distribution, which may be an alert for a downward breakout.
Accumulation/distribution indicator divergence
The bullish divergence is identified when the price exhibits a downward movement and the ADL indicator is rising. Therefore, the price will be at a lower low, while the accumulation distribution line will achieve a higher low. The bullish divergence alerts for a potential buy opportunity and you should go long on your trading position.
A bearish divergence occurs when the price increases and the accumulation distribution line indicator is decreasing. When you see a bearish divergence, it is a potential signal to enter short or sell positions. An example of bearish divergence set up is presented in the next graph.
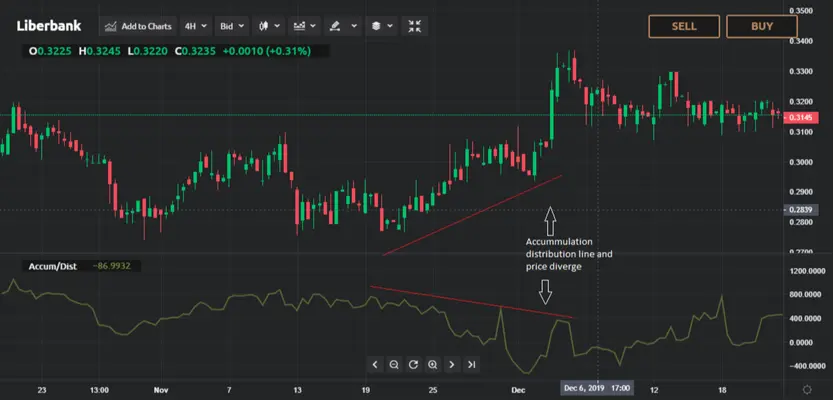
The price action and the ADL indicator move in opposite directions and the price has higher highs while the indicator displays lower highs. The bearish divergence alert showed potential sell points since the price starts to decrease.
The indicator is most applicable for ranging markets when you try to determine potential reversal signals. However, during trending markets, traders cautiously use the accumulation distribution strategy when they execute trades only in the direction of the trend. More precisely, during a strong upward trend, you should be looking for a buy signal and in a strong downward trend, you would open positions only when sell signals appear.
Avoid using the accumulation/distribution indicator as a standalone tool. You can apply ADL together with other technical indicators such as the moving average, relative strength index, MACD. Try to combine the ADL indicator with indicators that will measure other aspects of the price action, such as the momentum and volatility. You can test which volume indicator is best suitable for your trading strategy by testing some of the alternative volume indicators such as the on-balance volume (OBV) indicator. Although both ADL and OBV appear to be similar, there are certain differences in the way they are calculated. Some traders also apply both indicators as part of their trading strategy in order to obtain and confirm their signals.
Advantages and disadvantages of the accumulation/distribution indicator
ADL can offer an insight into the potential price action. By looking at a pressure piling up in the market, you can estimate the type of trading positions that may be taken. Another benefit of using the ADL is that it can help the traders confirm the trend strength.
However, the potential downside of the accumulation distribution indicator is that the Money Flow Multiplier doesn't include changes in price ranges between periods. Sometimes ADL may not reflect the price action, which means that potential gaps up also will not be reflected.
FURTHER READING: How to read and use the on-balance volume trading indicator
FURTHER READING: How to read and use the parabolic SAR trading indicator