USD/SGD

Gráfico de precios de US Dollar / Singapore Dollar - USD/SGD

1m
5m
15m
30m
1H
4H
1D
1W
Historia


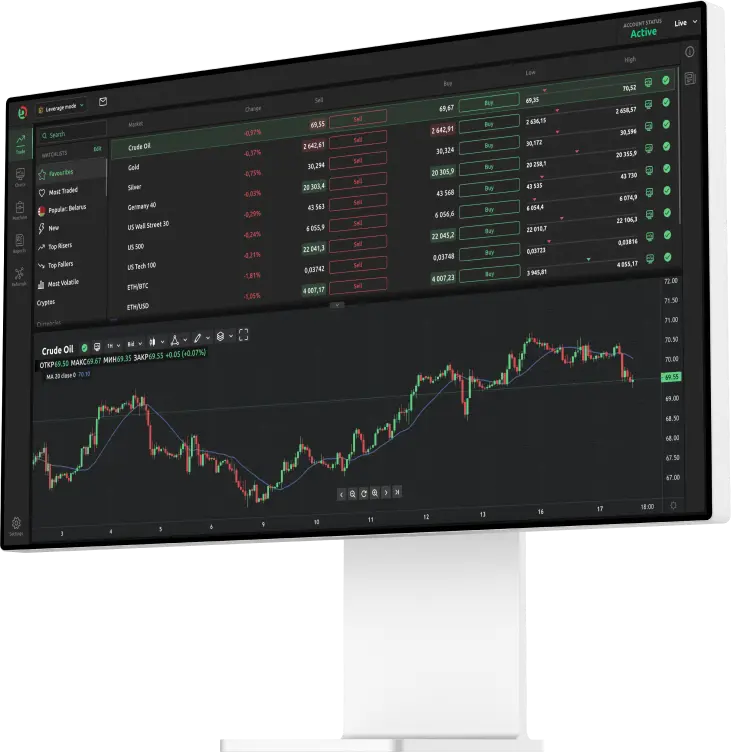
Negocie las mejores acciones, índices, materias primas y divisas tokenizadas del mundo con criptomonedas o fiat
1 BTC
Invertir
50 BTC
Ganancia
Apalancamiento:
x50

El poder del apalancamiento

Opere en las grandes ligas con 100 Bitcoin por cada 1 Bitcoin que ingrese

USD/SGD historial de precios

Fecha Cerca Cambio Cambio% Abierto Min. Max.
2022-09-30 1.28083 0.00059 0.05 1.28024 1.27945 1.28093
2022-09-30 1.28024 -0.00012 -0.01 1.28036 1.2801 1.28138
2022-09-30 1.27982 0.00067 0.05 1.27915 1.27889 1.28171
2022-09-30 1.27915 -0.00004 -0.00 1.27919 1.27816 1.2817
2022-09-30 1.2792 -0.00069 -0.05 1.27989 1.27913 1.28193
2022-09-30 1.27991 0.00119 0.09 1.27872 1.27614 1.28156
2022-09-30 1.27873 0.00464 0.36 1.27409 1.27357 1.28045
2022-09-30 1.27409 0.00200 0.16 1.27209 1.27202 1.2743
2022-09-30 1.27188 -0.00206 -0.16 1.27394 1.27188 1.27564
2022-09-30 1.27394 0.00131 0.10 1.27263 1.27131 1.27831
2022-09-30 1.27264 0.00025 0.02 1.27239 1.27162 1.27482
2022-09-30 1.27239 0.00175 0.14 1.27064 1.26962 1.27398
2022-09-30 1.27062 -0.00509 -0.40 1.27571 1.2701 1.27589
2022-09-30 1.27572 0.00180 0.14 1.27392 1.27377 1.27603
2022-09-30 1.27516 0.00011 0.01 1.27505 1.27308 1.2776
2022-09-30 1.27505 -0.00164 -0.13 1.27669 1.27117 1.27723
2022-09-30 1.27668 -0.00311 -0.24 1.27979 1.27631 1.28197
2022-09-30 1.27979 -0.00286 -0.22 1.28265 1.27626 1.28413
2022-09-30 1.28265 -0.00504 -0.39 1.28769 1.28136 1.29388
Go help.dzengi.com
Dzengi.com Exchange
Negocie BTC y acciones tokenizadas