Crypto as collateral. Trade the global financial markets using Bitcoin or Ethereum.
The first in Belarus
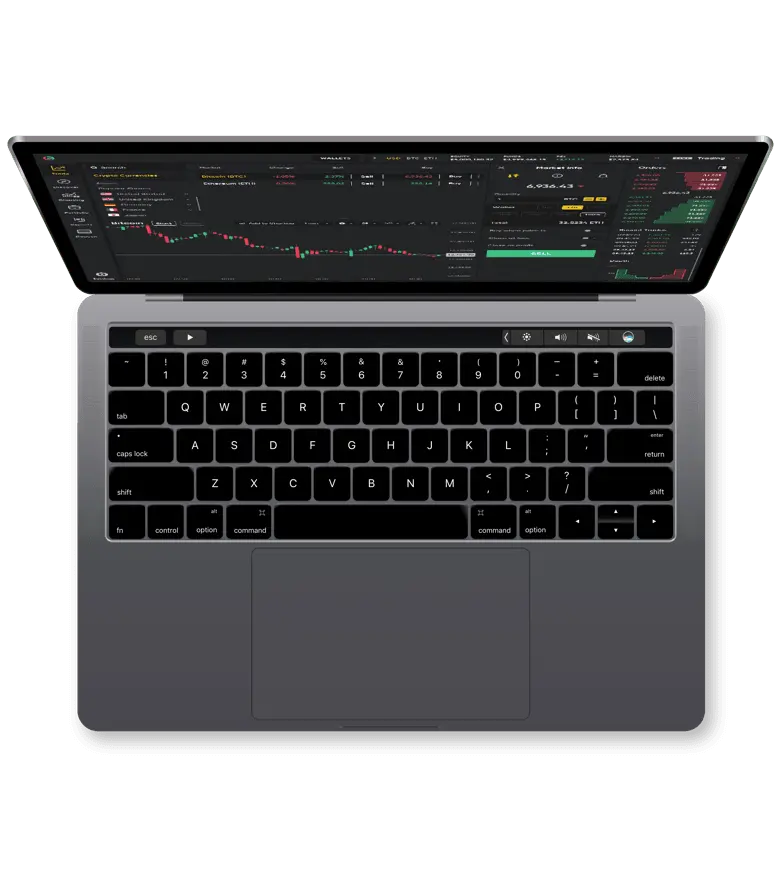
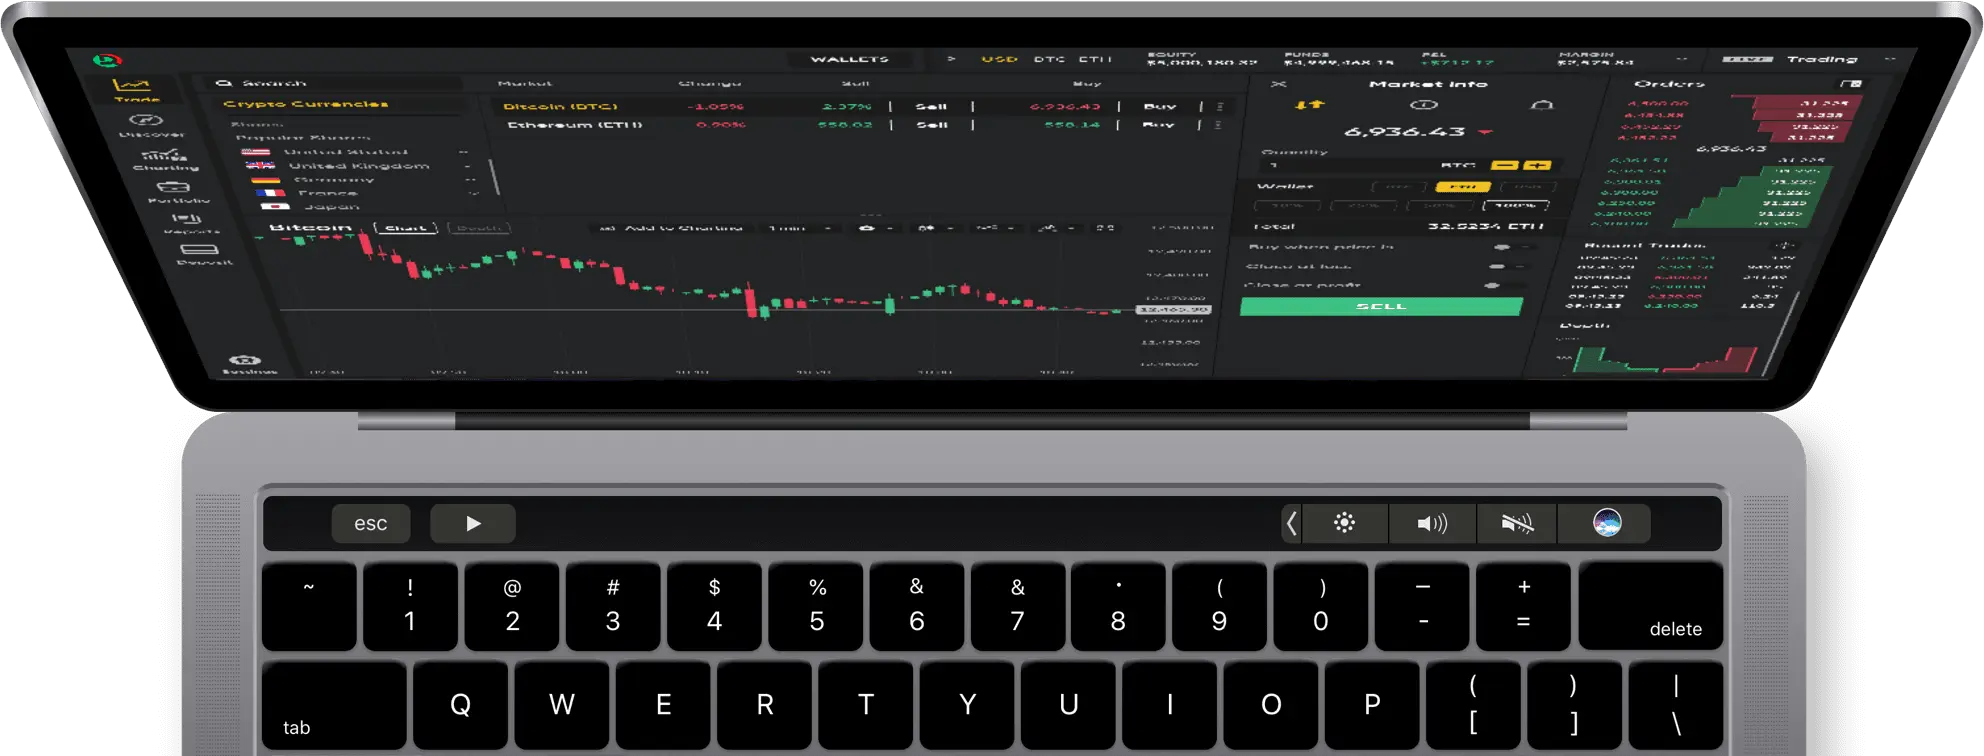
Our advanced web platform is the first regulated tokenised assets exchange in Belarus.
Be part of big market trends by trading the world’s top tokenised indices, like the S&P 500 or the FTSE 100, through tokenised assets – without ever exchanging your crypto for fiat.
| Icon | Name* | Sell | Buy | Chart(2d) |
|---|---|---|---|---|
|
US100 US Tech 100 |
30351.6 | 30354.1 | ||
|
US30 US Wall Street 30 |
51040 | 51051 | ||
|
DE40 Germany 40 |
25032.3 | 25051.3 | ||
|
US500 US 500 |
7584.1 | 7586.3 | ||
|
FR40 France 40 |
8137.4 | 8188.6 | ||
|
CN50 China A50 |
15823 | 15844 | ||
|
EU50 EU Stocks 50 |
6017.7 | 6030.2 | ||
|
SP35 Spain 35 |
18296.8 | 18317.6 | ||
|
NL25 Netherlands 25 |
1031.92 | 1032.73 | ||
|
IT40 Italy 40 |
49440 | 49469 | ||
|
UK100 UK 100 |
10365.9 | 10378.6 | ||
|
DXY US Dollar Index |
98.9570 | 99.0130 |
Our advanced web platform is the first regulated tokenised assets exchange in Belarus.
Crypto as collateral. Trade the global financial markets using Bitcoin or Ethereum.
Security as priority. The safety of your holdings is guaranteed in accordance with the legislation of the Republic of Belarus.
Technical indicators. Keep an eye on your positions with over 75 advanced charts, price analysis and price alerts.
Control your capital. Use stop-loss and take-profit orders to keep what you earn.
Use the world’s first regulated tokenised assets exchange to build a diverse investment portfolio with your crypto holdings. Make your deposits in Bitcoin or Ethereum to trade global financial instruments with competitive leverage and tight spreads. Dzengi.com keeps your holdings secure and accessible at a glance.